PROTECTED SOURCE SCRIPT
更新済 Heikin Ashi with EMA, BB, Momentum
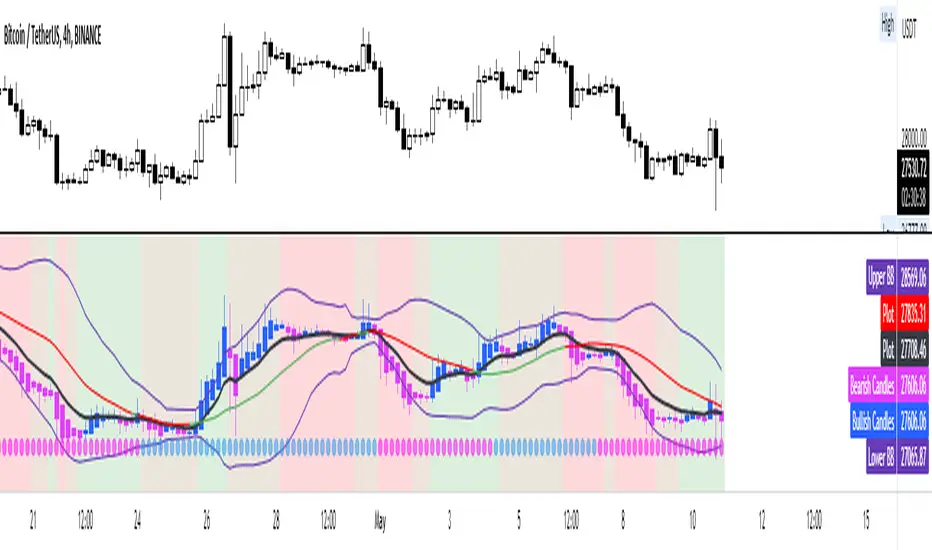
Convenient indicator to confirm a trend using heikin ashi candles.
The EMA 9 periods can be used as a trend confirmation using both the location of price and the slope of the EMA
Bollinger bands and their ma20 allows to account for volatility, range, squeeze, excess etc
This is all combined with a fast and slow momentum indicator based on the MACD.
The dots illustrate a slow/long-term momentum while the background color is the fast momentum.
Very useful indicator in my opinion to visualize the trend and momentum at the same time
リリースノート
updating the UIリリースノート
plotting arrows on main chart panel to avoid clutter保護スクリプト
このスクリプトのソースコードは非公開で投稿されています。 ただし、制限なく自由に使用できます – 詳細はこちらでご確認ください。
免責事項
この情報および投稿は、TradingViewが提供または推奨する金融、投資、トレード、その他のアドバイスや推奨を意図するものではなく、それらを構成するものでもありません。詳細は利用規約をご覧ください。
免責事項
この情報および投稿は、TradingViewが提供または推奨する金融、投資、トレード、その他のアドバイスや推奨を意図するものではなく、それらを構成するものでもありません。詳細は利用規約をご覧ください。