OPEN-SOURCE SCRIPT
IU SIP CALCULATOR
How This Indicator Script Works:
1. This indicator script calculate the monthly SIP returns of any market over any user defined period.
2. SIP stands for Systematic Investment Plan. It is a way to invest in any asset by regularly investing a fixed amount of money at regular intervals for example Monthly, Weekly, Quarterly etc.
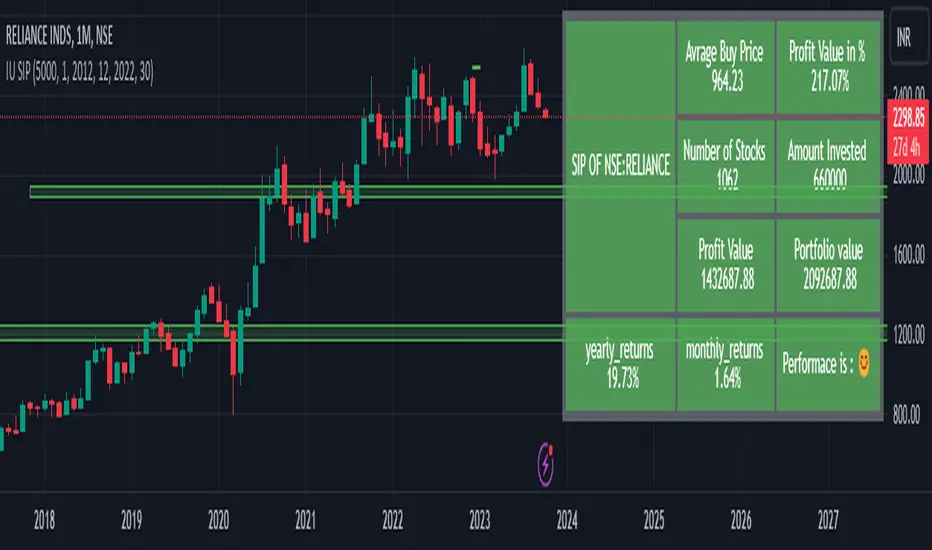
3. This indicator Calculate the following
# Average buy price
# Total quantity hold
# Yearly returns
# Monthly returns
# Total invested amount
# Total profits in amount
# Total portfolio value
# Total returns in per percentage term.
4. This script takes monthly SIP amount, starting month, starting year, ending year, ending month from the user and store the value for calculations.
5. After that it store the open price of every month into an array then it average the array and compare that price with the last month close price.
6. on the bases of this it performs all of the calculations.
7. The script plot every calculation into an table from.
8. It requires monthly chart timeframe for working.
9. The table is editable user can change the color and transparency.
How User Can Benefit From The Script:
1. User can get the past monthly SIP returns of any market he wants to invest this will give him an overview about what to expect from the market.
2. Once user understand the expected returns from the market he can adjust his investment strategy.
3. This help the user to Analyse various stocks and their past performance.
4. User can also short list the best performed stocks.
5. Over all this script will give complete SIP vision of any market.
1. This indicator script calculate the monthly SIP returns of any market over any user defined period.
2. SIP stands for Systematic Investment Plan. It is a way to invest in any asset by regularly investing a fixed amount of money at regular intervals for example Monthly, Weekly, Quarterly etc.
3. This indicator Calculate the following
# Average buy price
# Total quantity hold
# Yearly returns
# Monthly returns
# Total invested amount
# Total profits in amount
# Total portfolio value
# Total returns in per percentage term.
4. This script takes monthly SIP amount, starting month, starting year, ending year, ending month from the user and store the value for calculations.
5. After that it store the open price of every month into an array then it average the array and compare that price with the last month close price.
6. on the bases of this it performs all of the calculations.
7. The script plot every calculation into an table from.
8. It requires monthly chart timeframe for working.
9. The table is editable user can change the color and transparency.
How User Can Benefit From The Script:
1. User can get the past monthly SIP returns of any market he wants to invest this will give him an overview about what to expect from the market.
2. Once user understand the expected returns from the market he can adjust his investment strategy.
3. This help the user to Analyse various stocks and their past performance.
4. User can also short list the best performed stocks.
5. Over all this script will give complete SIP vision of any market.
オープンソーススクリプト
TradingViewの精神に則り、このスクリプトの作者はコードをオープンソースとして公開してくれました。トレーダーが内容を確認・検証できるようにという配慮です。作者に拍手を送りましょう!無料で利用できますが、コードの再公開はハウスルールに従う必要があります。
Shivam mandai
免責事項
この情報および投稿は、TradingViewが提供または推奨する金融、投資、トレード、その他のアドバイスや推奨を意図するものではなく、それらを構成するものでもありません。詳細は利用規約をご覧ください。
オープンソーススクリプト
TradingViewの精神に則り、このスクリプトの作者はコードをオープンソースとして公開してくれました。トレーダーが内容を確認・検証できるようにという配慮です。作者に拍手を送りましょう!無料で利用できますが、コードの再公開はハウスルールに従う必要があります。
Shivam mandai
免責事項
この情報および投稿は、TradingViewが提供または推奨する金融、投資、トレード、その他のアドバイスや推奨を意図するものではなく、それらを構成するものでもありません。詳細は利用規約をご覧ください。