OPEN-SOURCE SCRIPT
Weekly Open Percent Range
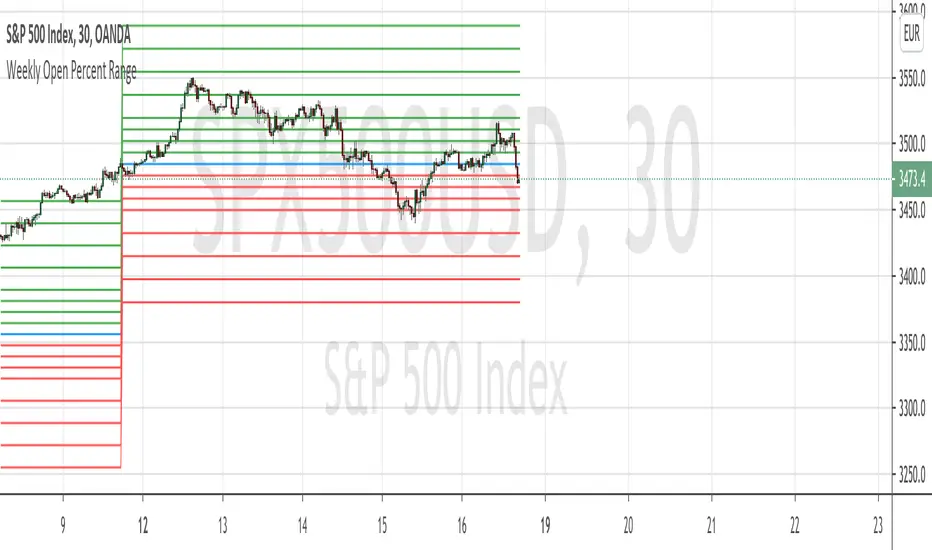
A simple take on finding percentage gain/drop range in a week for ranging or trending market instrument.
This script is hard coded to plot 0 to 3%, -3% range for the week base on instrument weekly open price.
Best to use with measured volatility indicator to gauge the movement of price. Anytime the price goes above the range level then it is likely to be trending. Highly volatile instruments will not find this indicator useful. It is best for heavy instruments like Forex or Indices where range % in a week in a non-volatile move is really quite small that these act as resistances and support.
Range Levels:
3%
2.5%
2%
1.5%
1%
0.75%
0.5%
0.25%
0%
-.25%
-.5%
-.75%
-1%
-1.5%
-2%
-2.5%
-3%
The next step for this indicator is to consider volatility range of instrument and to include this in the percentage zone levels instead of hard coding these.
オープンソーススクリプト
TradingViewの精神に則り、このスクリプトの作者はコードをオープンソースとして公開してくれました。トレーダーが内容を確認・検証できるようにという配慮です。作者に拍手を送りましょう!無料で利用できますが、コードの再公開はハウスルールに従う必要があります。
免責事項
この情報および投稿は、TradingViewが提供または推奨する金融、投資、トレード、その他のアドバイスや推奨を意図するものではなく、それらを構成するものでもありません。詳細は利用規約をご覧ください。
オープンソーススクリプト
TradingViewの精神に則り、このスクリプトの作者はコードをオープンソースとして公開してくれました。トレーダーが内容を確認・検証できるようにという配慮です。作者に拍手を送りましょう!無料で利用できますが、コードの再公開はハウスルールに従う必要があります。
免責事項
この情報および投稿は、TradingViewが提供または推奨する金融、投資、トレード、その他のアドバイスや推奨を意図するものではなく、それらを構成するものでもありません。詳細は利用規約をご覧ください。