OPEN-SOURCE SCRIPT
SuperTrend Polyfactor Oscillator [LuxAlgo]

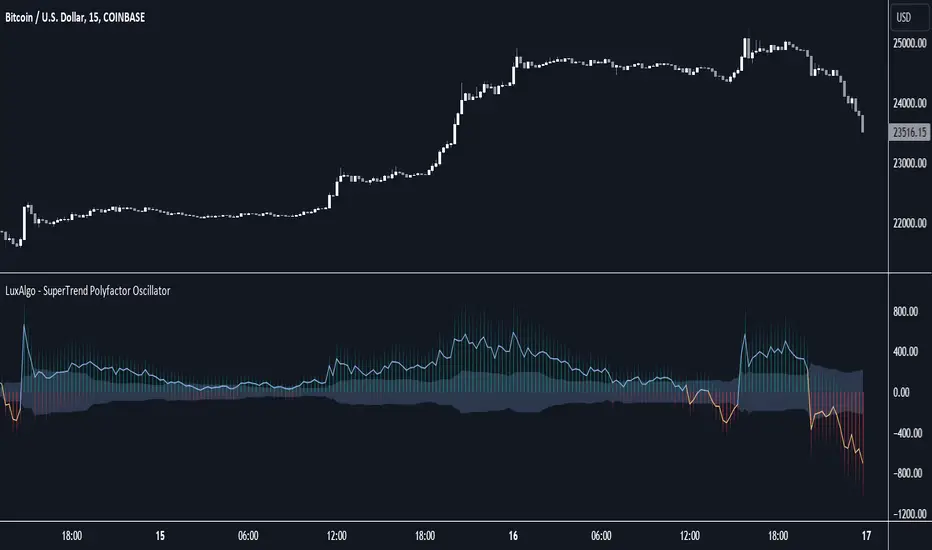
The SuperTrend Polyfactor Oscillator is an oscillator based on the popular SuperTrend indicator that aims to highlight information returned by a collection of SuperTrends with varying factors inputs.
A general consensus is calculated from all this information, returning an indication of the current market sentiment.
🔶 USAGE

Multiple elements are highlighted by the proposed oscillator. A mesh of bars is constructed from the difference between the price and a total of 20 SuperTrends with varying factors. Brighter colors of the mesh indicate a higher amount of aligned SuperTrends indications.

The factor input of the SuperTrends is determined by the user from the Starting Factor setting which determines the factor of the shorter-term SuperTrend, and the Increment settings which control the step between each factor inputs.
Using higher values for these settings will return information for longer-term term price variations.
🔹Consensus

From the collection of SuperTrends, a consensus is obtained. It is calculated as the median of all the differences between the price and the collection of SuperTrends.
This consensus is highlighted in the script by a blue and orange line, with a blue color indicating an overall bullish market, and orange indicating a bearish market.

Both elements can be used together to highlight retracements within a trend. If we see various red bars while the general consensus is bullish, we can interpret it as the presence of a retracement.
🔹StDev Area
The indicator includes an area constructed from the standard deviation of all the differences between the price and the collection of SuperTrends.

This area can be useful to see if the market is overall trending or ranging, with a consensus over the area indicative of a trending market.
🔹Normalization
Users can decide to normalize the results and constrain them within a specific range, this can allow obtaining a lower degree of variations of the indicator outputs. Two methods are proposed "Absolute Sum", and "Max-Min".

The "Absolute Sum" method will divide any output returned by the indicator by the absolute sum of all the differences between the price and SuperTrends. This will constrain all the indicator elements in a (1, -1) scale.

The "Max-Min" method will apply min-max normalization to the indicator outputs (with the exception of the stdev area). This will constrain all the indicator elements in a (0, 1) scale.
🔶 SETTINGS
A general consensus is calculated from all this information, returning an indication of the current market sentiment.
🔶 USAGE
Multiple elements are highlighted by the proposed oscillator. A mesh of bars is constructed from the difference between the price and a total of 20 SuperTrends with varying factors. Brighter colors of the mesh indicate a higher amount of aligned SuperTrends indications.
The factor input of the SuperTrends is determined by the user from the Starting Factor setting which determines the factor of the shorter-term SuperTrend, and the Increment settings which control the step between each factor inputs.
Using higher values for these settings will return information for longer-term term price variations.
🔹Consensus
From the collection of SuperTrends, a consensus is obtained. It is calculated as the median of all the differences between the price and the collection of SuperTrends.
This consensus is highlighted in the script by a blue and orange line, with a blue color indicating an overall bullish market, and orange indicating a bearish market.
Both elements can be used together to highlight retracements within a trend. If we see various red bars while the general consensus is bullish, we can interpret it as the presence of a retracement.
🔹StDev Area
The indicator includes an area constructed from the standard deviation of all the differences between the price and the collection of SuperTrends.
This area can be useful to see if the market is overall trending or ranging, with a consensus over the area indicative of a trending market.
🔹Normalization
Users can decide to normalize the results and constrain them within a specific range, this can allow obtaining a lower degree of variations of the indicator outputs. Two methods are proposed "Absolute Sum", and "Max-Min".
The "Absolute Sum" method will divide any output returned by the indicator by the absolute sum of all the differences between the price and SuperTrends. This will constrain all the indicator elements in a (1, -1) scale.
The "Max-Min" method will apply min-max normalization to the indicator outputs (with the exception of the stdev area). This will constrain all the indicator elements in a (0, 1) scale.
🔶 SETTINGS
- Length: ATR Length of all calculated SuperTrends.
- Starting Factor: Factor input of the shorter-term SuperTrend.
- Increment: Step value between all SuperTrends factors.
- Normalize: Normalization method used to rescale the indicator output.
オープンソーススクリプト
TradingViewの精神に則り、このスクリプトの作者はコードをオープンソースとして公開してくれました。トレーダーが内容を確認・検証できるようにという配慮です。作者に拍手を送りましょう!無料で利用できますが、コードの再公開はハウスルールに従う必要があります。
Get exclusive indicators & AI trading strategies: luxalgo.com
Free 150k+ community: discord.gg/lux
All content provided by LuxAlgo is for informational & educational purposes only. Past performance does not guarantee future results.
Free 150k+ community: discord.gg/lux
All content provided by LuxAlgo is for informational & educational purposes only. Past performance does not guarantee future results.
免責事項
この情報および投稿は、TradingViewが提供または推奨する金融、投資、トレード、その他のアドバイスや推奨を意図するものではなく、それらを構成するものでもありません。詳細は利用規約をご覧ください。