OPEN-SOURCE SCRIPT
EM Yield Curve Index
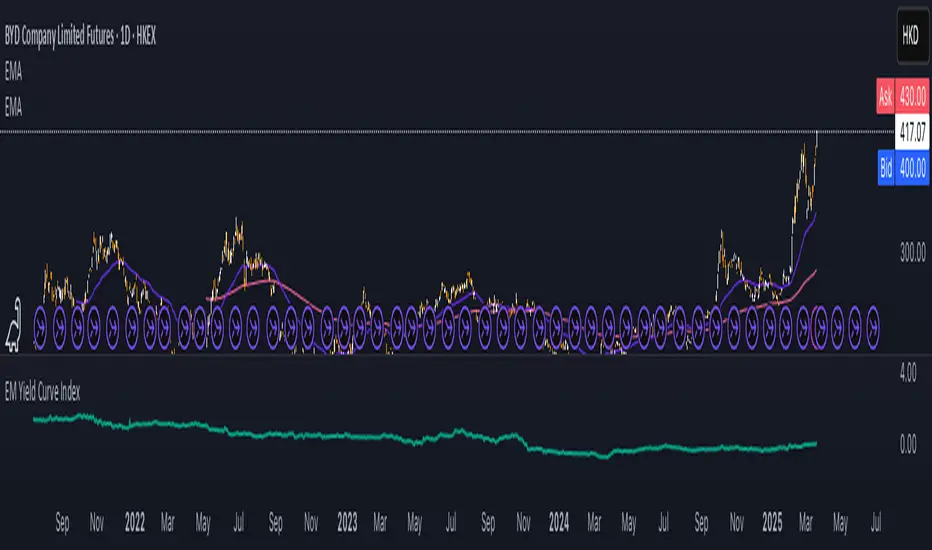
This script calculates the Emerging Markets (EM) Yield Curve Index by aggregating the 2-year and 10-year bond yields of major emerging economies. The bond yields are weighted based on each country's bond market size, with data sourced from TradingView. The yield curve is derived by subtracting the 2-year yield from the 10-year yield, providing insights into economic conditions, risk sentiment, and potential recessions in emerging markets. The resulting EM Yield Curve Index is plotted for visualization.
Note: In some cases, TradingView's TVC data did not provide a 2-year bond yield. When this occurred, the best available alternative yield (such as 3-month, 1-year or 4-year yields) was used to approximate the short-term interest rate for that country.
Note: In some cases, TradingView's TVC data did not provide a 2-year bond yield. When this occurred, the best available alternative yield (such as 3-month, 1-year or 4-year yields) was used to approximate the short-term interest rate for that country.
オープンソーススクリプト
TradingViewの精神に則り、このスクリプトの作者はコードをオープンソースとして公開してくれました。トレーダーが内容を確認・検証できるようにという配慮です。作者に拍手を送りましょう!無料で利用できますが、コードの再公開はハウスルールに従う必要があります。
免責事項
この情報および投稿は、TradingViewが提供または推奨する金融、投資、トレード、その他のアドバイスや推奨を意図するものではなく、それらを構成するものでもありません。詳細は利用規約をご覧ください。
オープンソーススクリプト
TradingViewの精神に則り、このスクリプトの作者はコードをオープンソースとして公開してくれました。トレーダーが内容を確認・検証できるようにという配慮です。作者に拍手を送りましょう!無料で利用できますが、コードの再公開はハウスルールに従う必要があります。
免責事項
この情報および投稿は、TradingViewが提供または推奨する金融、投資、トレード、その他のアドバイスや推奨を意図するものではなく、それらを構成するものでもありません。詳細は利用規約をご覧ください。