OPEN-SOURCE SCRIPT
Colored Moving Averages With RSI Signals
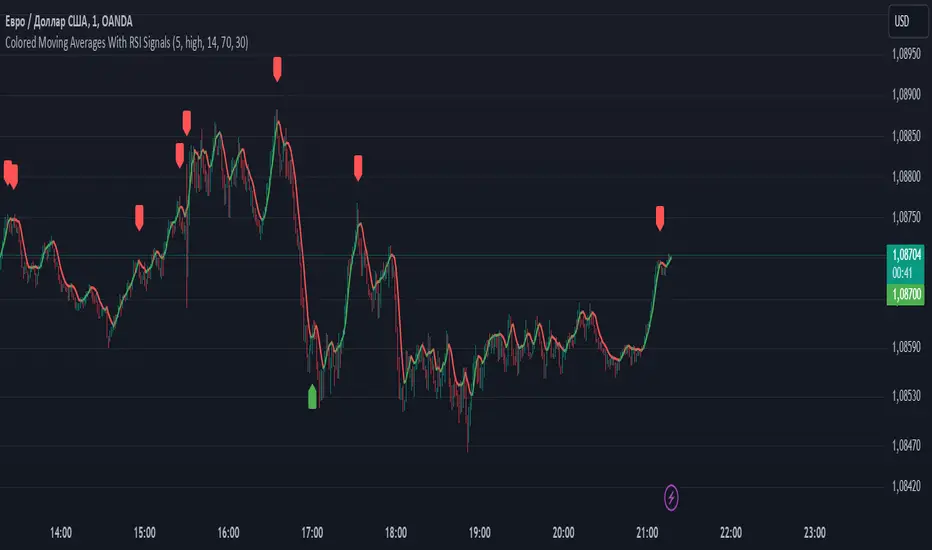
Moving Average (MA):
Helps to determine the overall market trend. If the price is above the MA, it may indicate an uptrend, and if below, a downtrend.
In this case, a Simple Moving Average (SMA) is used, but other types can be applied as well.
Relative Strength Index (RSI):
This is an oscillator that measures the speed and changes of price movements.
Values above 70 indicate overbought conditions (possible sell signal), while values below 30 indicate oversold conditions (possible buy signal).
Purpose of This Indicator:
Trading Signals: The indicator generates "Buy" and "Sell" signals based on the intersection of the price line and the moving average, as well as RSI values. This helps traders make more informed decisions.
Signal Filtering: Using RSI in combination with MA allows for filtering false signals since it considers not only the current trend but also the state of overbought or oversold conditions.
How to Use:
For Short-Term Trading: Traders can use buy and sell signals to enter trades based on short-term market fluctuations.
In Combination with Other Indicators: It can be combined with other indicators for a more comprehensive analysis (e.g., adding support and resistance levels).
Overall, this indicator helps traders respond more quickly and accurately to changes in market conditions, enhancing the chances of successful trades.
オープンソーススクリプト
TradingViewの精神に則り、このスクリプトの作者はコードをオープンソースとして公開してくれました。トレーダーが内容を確認・検証できるようにという配慮です。作者に拍手を送りましょう!無料で利用できますが、コードの再公開はハウスルールに従う必要があります。
免責事項
この情報および投稿は、TradingViewが提供または推奨する金融、投資、トレード、その他のアドバイスや推奨を意図するものではなく、それらを構成するものでもありません。詳細は利用規約をご覧ください。
オープンソーススクリプト
TradingViewの精神に則り、このスクリプトの作者はコードをオープンソースとして公開してくれました。トレーダーが内容を確認・検証できるようにという配慮です。作者に拍手を送りましょう!無料で利用できますが、コードの再公開はハウスルールに従う必要があります。
免責事項
この情報および投稿は、TradingViewが提供または推奨する金融、投資、トレード、その他のアドバイスや推奨を意図するものではなく、それらを構成するものでもありません。詳細は利用規約をご覧ください。