OPEN-SOURCE SCRIPT
Balgat Ekibi
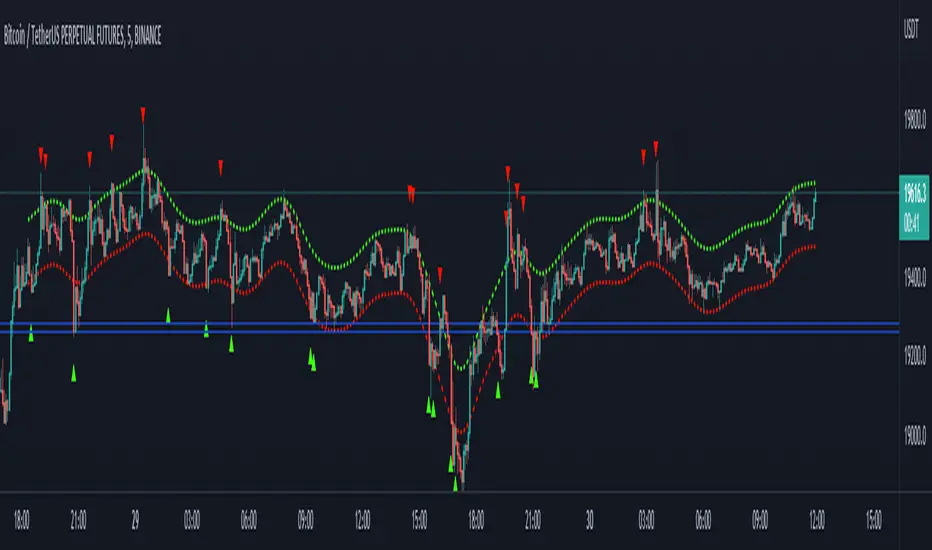
Bands are calculated with the std error and variance of the price actions. So if price cross up or cross down the variance bands, you could expect a reversal movement.
So if price cross up with the bands and after that there is a reversal candle movement, a short position could be taken.
If price cross down to the bands and after that there is a reversal candle movement, a long positon could be taken.
All risk management and money management is up to you.
So if price cross up with the bands and after that there is a reversal candle movement, a short position could be taken.
If price cross down to the bands and after that there is a reversal candle movement, a long positon could be taken.
All risk management and money management is up to you.
オープンソーススクリプト
TradingViewの精神に則り、このスクリプトの作者はコードをオープンソースとして公開してくれました。トレーダーが内容を確認・検証できるようにという配慮です。作者に拍手を送りましょう!無料で利用できますが、コードの再公開はハウスルールに従う必要があります。
免責事項
この情報および投稿は、TradingViewが提供または推奨する金融、投資、トレード、その他のアドバイスや推奨を意図するものではなく、それらを構成するものでもありません。詳細は利用規約をご覧ください。
オープンソーススクリプト
TradingViewの精神に則り、このスクリプトの作者はコードをオープンソースとして公開してくれました。トレーダーが内容を確認・検証できるようにという配慮です。作者に拍手を送りましょう!無料で利用できますが、コードの再公開はハウスルールに従う必要があります。
免責事項
この情報および投稿は、TradingViewが提供または推奨する金融、投資、トレード、その他のアドバイスや推奨を意図するものではなく、それらを構成するものでもありません。詳細は利用規約をご覧ください。