OPEN-SOURCE SCRIPT
High Volume Vector Candles
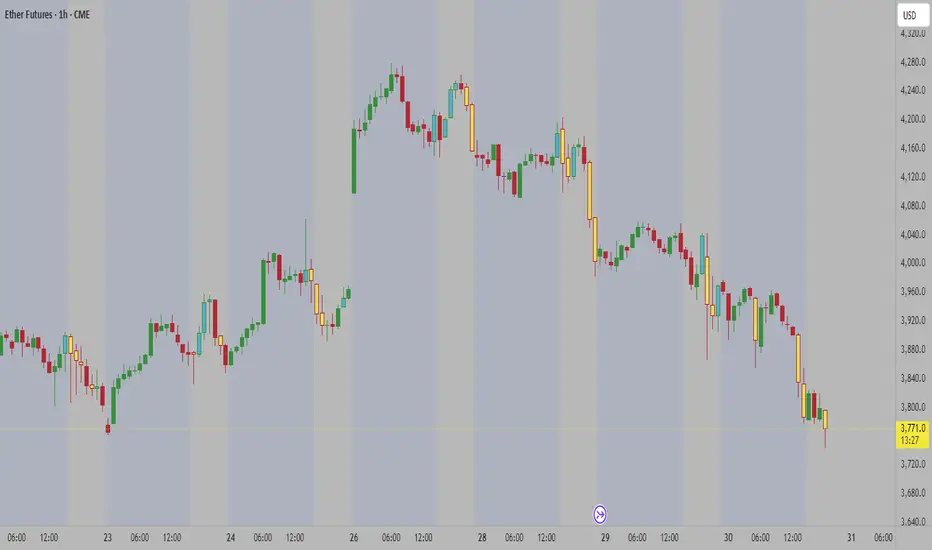
High Volume Vector Candles highlights candles where trading activity significantly exceeds the average, helping you quickly identify powerful moves driven by strong volume.
How it works:
- The script calculates a moving average of volume over a user-defined period.
- When current volume exceeds the chosen threshold (e.g. 150% of the average), the candle is marked as a high-volume event.
- Bullish high-volume candles are highlighted in blue tones, while bearish ones are shown in yellow, both with adjustable opacity.
This visualization makes it easier to spot potential breakout points, absorption zones, or institutional activity directly on your chart.
Customizable Settings:
• Moving average length
• Threshold percentage above average
• Bullish/Bearish highlight colors
• Opacity level
Ideal for traders who combine price action with volume analysis to anticipate market momentum.
オープンソーススクリプト
TradingViewの精神に則り、このスクリプトの作者はコードをオープンソースとして公開してくれました。トレーダーが内容を確認・検証できるようにという配慮です。作者に拍手を送りましょう!無料で利用できますが、コードの再公開はハウスルールに従う必要があります。
免責事項
この情報および投稿は、TradingViewが提供または推奨する金融、投資、トレード、その他のアドバイスや推奨を意図するものではなく、それらを構成するものでもありません。詳細は利用規約をご覧ください。
オープンソーススクリプト
TradingViewの精神に則り、このスクリプトの作者はコードをオープンソースとして公開してくれました。トレーダーが内容を確認・検証できるようにという配慮です。作者に拍手を送りましょう!無料で利用できますが、コードの再公開はハウスルールに従う必要があります。
免責事項
この情報および投稿は、TradingViewが提供または推奨する金融、投資、トレード、その他のアドバイスや推奨を意図するものではなく、それらを構成するものでもありません。詳細は利用規約をご覧ください。