OPEN-SOURCE SCRIPT
更新済 Candle Thermals
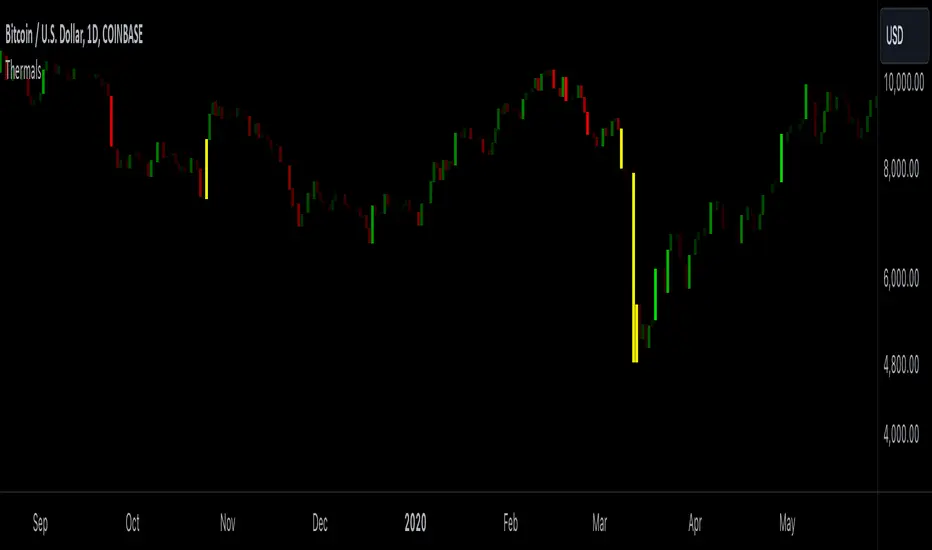
This indicator color candles based on their percentage price change, relative to the average, maximum, and minimum changes over the last 100 candles.
-It calculates the percentage change of all candles
-Calculates the minimum, maximum and average in the last 100 bars in percentage change
-Changes color of the candle based on the range between the current percent and min/max value
-The brightest candle provides the highest compound effect to you account if you act on it at the open.
-Candles that have a percentage close to the average then they are barely visible = lowest compound effect to your account
This indicator functions like a "heatmap" for candles, highlighting the relative volatility of price movements in both directions. Strong bullish candles are brighter green, and strong bearish candles are brighter red. It's particularly useful for traders wanting quick visual feedback on price volatility and strength trends within the last 100 bars.
リリースノート
we have made the candles yellow if they reach maximum or minimum values in percentage change. meaning those are the candles which you will achieve the highest compound effect オープンソーススクリプト
TradingViewの精神に則り、このスクリプトの作者はコードをオープンソースとして公開してくれました。トレーダーが内容を確認・検証できるようにという配慮です。作者に拍手を送りましょう!無料で利用できますが、コードの再公開はハウスルールに従う必要があります。
免責事項
この情報および投稿は、TradingViewが提供または推奨する金融、投資、トレード、その他のアドバイスや推奨を意図するものではなく、それらを構成するものでもありません。詳細は利用規約をご覧ください。
オープンソーススクリプト
TradingViewの精神に則り、このスクリプトの作者はコードをオープンソースとして公開してくれました。トレーダーが内容を確認・検証できるようにという配慮です。作者に拍手を送りましょう!無料で利用できますが、コードの再公開はハウスルールに従う必要があります。
免責事項
この情報および投稿は、TradingViewが提供または推奨する金融、投資、トレード、その他のアドバイスや推奨を意図するものではなく、それらを構成するものでもありません。詳細は利用規約をご覧ください。