OPEN-SOURCE SCRIPT
[Hoss] VWAP AD
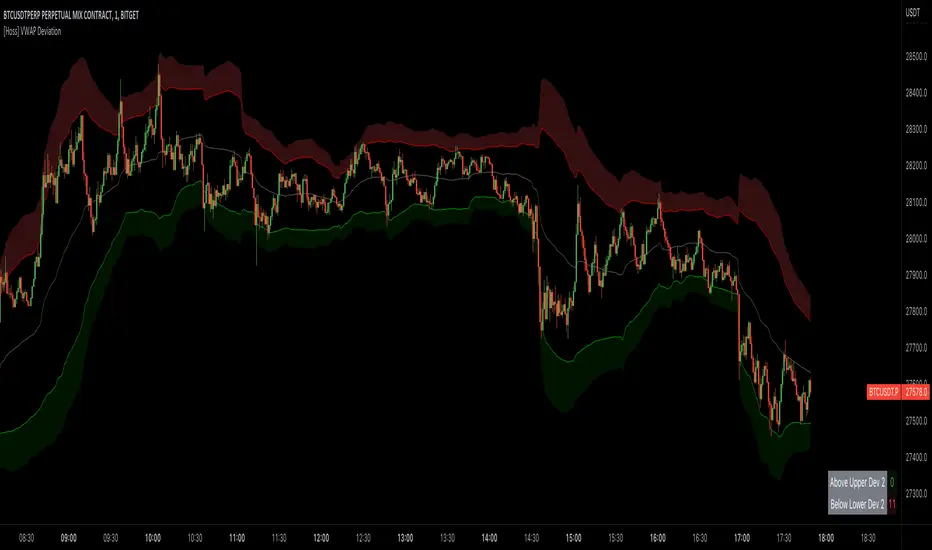
The VWAP ( Volume Weighted Average Price ) Deviation script is a powerful tool designed for traders to analyze the relationship between price and volume . By calculating deviations around the VWAP , the script allows users to identify key support and resistance levels that can help in making better-informed trading decisions.
The script calculates VWAP based on the chosen data source (default is closing price) and then computes deviations above and below the VWAP using either the Average Deviation or the Standard Deviation method. The user can select the desired method through the script's input options. These deviations are then plotted as bands on the chart, providing a visual representation of the areas where the price may potentially revert or experience a breakout.
A unique and valuable feature of this script is the addition of a monitor that counts the number of times the price crosses above the Upper Deviation level 2 and below the Lower Deviation level 2 within a user-defined lookback period. This monitor is displayed as a table in the bottom right corner of the chart and can be enabled or disabled through an input option.
The cross count monitor serves as a valuable aid to traders by providing insights into the historical frequency of price crossing the deviation levels. This information can be used to identify potential trading opportunities based on historical price behavior around these levels.
オープンソーススクリプト
TradingViewの精神に則り、このスクリプトの作者はコードをオープンソースとして公開してくれました。トレーダーが内容を確認・検証できるようにという配慮です。作者に拍手を送りましょう!無料で利用できますが、コードの再公開はハウスルールに従う必要があります。
macro maximalist
免責事項
この情報および投稿は、TradingViewが提供または推奨する金融、投資、トレード、その他のアドバイスや推奨を意図するものではなく、それらを構成するものでもありません。詳細は利用規約をご覧ください。
オープンソーススクリプト
TradingViewの精神に則り、このスクリプトの作者はコードをオープンソースとして公開してくれました。トレーダーが内容を確認・検証できるようにという配慮です。作者に拍手を送りましょう!無料で利用できますが、コードの再公開はハウスルールに従う必要があります。
macro maximalist
免責事項
この情報および投稿は、TradingViewが提供または推奨する金融、投資、トレード、その他のアドバイスや推奨を意図するものではなく、それらを構成するものでもありません。詳細は利用規約をご覧ください。