OPEN-SOURCE SCRIPT
EMA Reversal Point
EMA Reversal Point
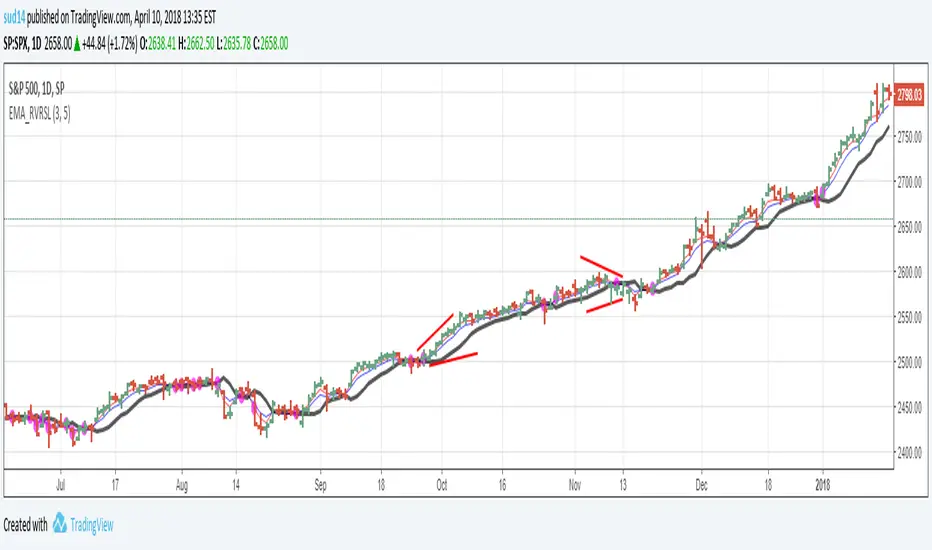
The script calculates the "likely" reversal point of 2 EMAs (3 and 5 for example) and plots as a line. The points there the EMA cross are highlighted with a Purple circle.
The way I use this indicator is by visually confirming that the reversal line is diverting away from price in case of strong trends.
Divergences between reversal line and price line are good entry points.
Wait for the price bar to clear the reversal line completely before initiating trades. (No overlaps!)
This is my first indicator script so please be kind on the comments!!
オープンソーススクリプト
TradingViewの精神に則り、このスクリプトの作者はコードをオープンソースとして公開してくれました。トレーダーが内容を確認・検証できるようにという配慮です。作者に拍手を送りましょう!無料で利用できますが、コードの再公開はハウスルールに従う必要があります。
免責事項
この情報および投稿は、TradingViewが提供または推奨する金融、投資、トレード、その他のアドバイスや推奨を意図するものではなく、それらを構成するものでもありません。詳細は利用規約をご覧ください。
オープンソーススクリプト
TradingViewの精神に則り、このスクリプトの作者はコードをオープンソースとして公開してくれました。トレーダーが内容を確認・検証できるようにという配慮です。作者に拍手を送りましょう!無料で利用できますが、コードの再公開はハウスルールに従う必要があります。
免責事項
この情報および投稿は、TradingViewが提供または推奨する金融、投資、トレード、その他のアドバイスや推奨を意図するものではなく、それらを構成するものでもありません。詳細は利用規約をご覧ください。