OPEN-SOURCE SCRIPT
更新済 My:MANNARINO MARKET RISK INDICATOR
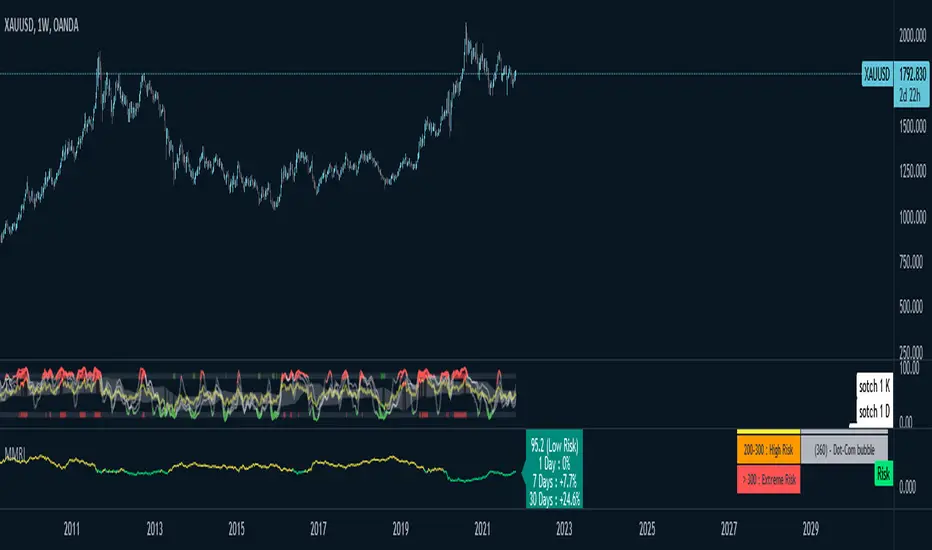
Based on the Risk Factor
This indicator shows the current Risk state of the market.
Historically, a high risk number was followed by a downtrend (to not say crash) in the market.
The indicator has 2 configuration options : Show Historic and Show Scale
- When Show Historic is checked, a new column is showing with the 3 last market crashes and what was the Risk Value
- When Show Scale is checked, a new column is showing with the 4 different states of the Risk, low - medium - high - extreme
リリースノート
One additional configuration option : Mode -> Show the Risk in a simplified view (table) at the bottom right of the panel or show the Risk in a line chart in a separate panel.When the mode is on Table, you can move the panel using the 3 dots dropdown menu "Move the panel to the upside".
Here is the new mode "Chart Line", including a % of progression in the tooltip since the last 1-7-30 days
オープンソーススクリプト
TradingViewの精神に則り、このスクリプトの作者はコードをオープンソースとして公開してくれました。トレーダーが内容を確認・検証できるようにという配慮です。作者に拍手を送りましょう!無料で利用できますが、コードの再公開はハウスルールに従う必要があります。
免責事項
この情報および投稿は、TradingViewが提供または推奨する金融、投資、トレード、その他のアドバイスや推奨を意図するものではなく、それらを構成するものでもありません。詳細は利用規約をご覧ください。
オープンソーススクリプト
TradingViewの精神に則り、このスクリプトの作者はコードをオープンソースとして公開してくれました。トレーダーが内容を確認・検証できるようにという配慮です。作者に拍手を送りましょう!無料で利用できますが、コードの再公開はハウスルールに従う必要があります。
免責事項
この情報および投稿は、TradingViewが提供または推奨する金融、投資、トレード、その他のアドバイスや推奨を意図するものではなく、それらを構成するものでもありません。詳細は利用規約をご覧ください。