OPEN-SOURCE SCRIPT
更新済 MTF Combo
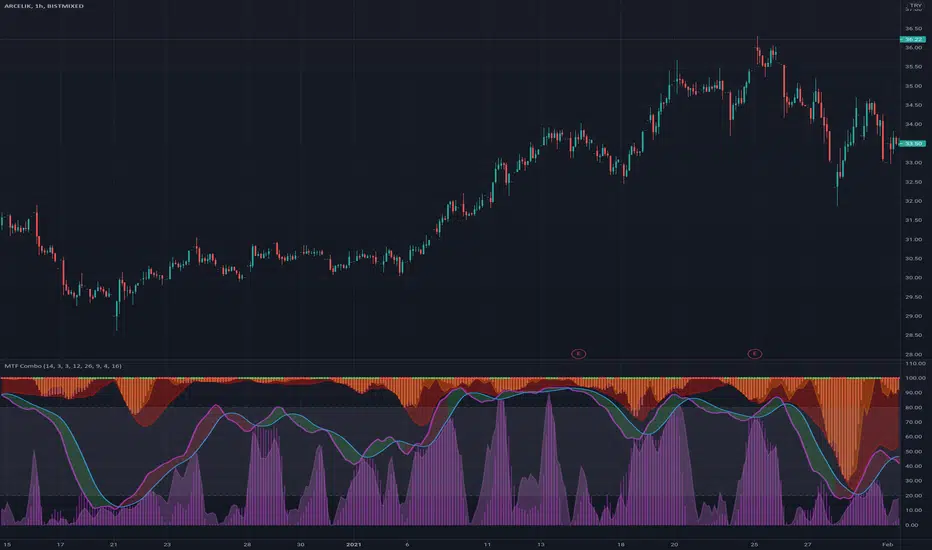
Middle stochastic is the HTF stochastic of price. The color coding indicates the trend in even higher timeframe.
- The graph on top is the stochastic of ATR (with HTF and current one with RSI and macd histogram).
- The green graph at the bottom is the stochastic of the OBV (with HTF and current one with RSI and macd histogram).
- Purple histogram and area underneath the mid-stochsatic are the macd histogram and the stochastic RSI.
- The dots in the middle are determined by the combined score of all
リリースノート
Stochastic OBV is moved to the topオープンソーススクリプト
TradingViewの精神に則り、このスクリプトの作者はコードをオープンソースとして公開してくれました。トレーダーが内容を確認・検証できるようにという配慮です。作者に拍手を送りましょう!無料で利用できますが、コードの再公開はハウスルールに従う必要があります。
免責事項
この情報および投稿は、TradingViewが提供または推奨する金融、投資、トレード、その他のアドバイスや推奨を意図するものではなく、それらを構成するものでもありません。詳細は利用規約をご覧ください。
オープンソーススクリプト
TradingViewの精神に則り、このスクリプトの作者はコードをオープンソースとして公開してくれました。トレーダーが内容を確認・検証できるようにという配慮です。作者に拍手を送りましょう!無料で利用できますが、コードの再公開はハウスルールに従う必要があります。
免責事項
この情報および投稿は、TradingViewが提供または推奨する金融、投資、トレード、その他のアドバイスや推奨を意図するものではなく、それらを構成するものでもありません。詳細は利用規約をご覧ください。