OPEN-SOURCE SCRIPT
New York Master Range
📈 New York Master Range (5-Min Timeframe)
Description:
This custom TradingView indicator captures the opening range based on the body high and low of the first 3 candles after 10:30 AM (BRT – Brasília Time) on the 5-minute timeframe — a technique often used during the New York market session.
🔍 How it works:
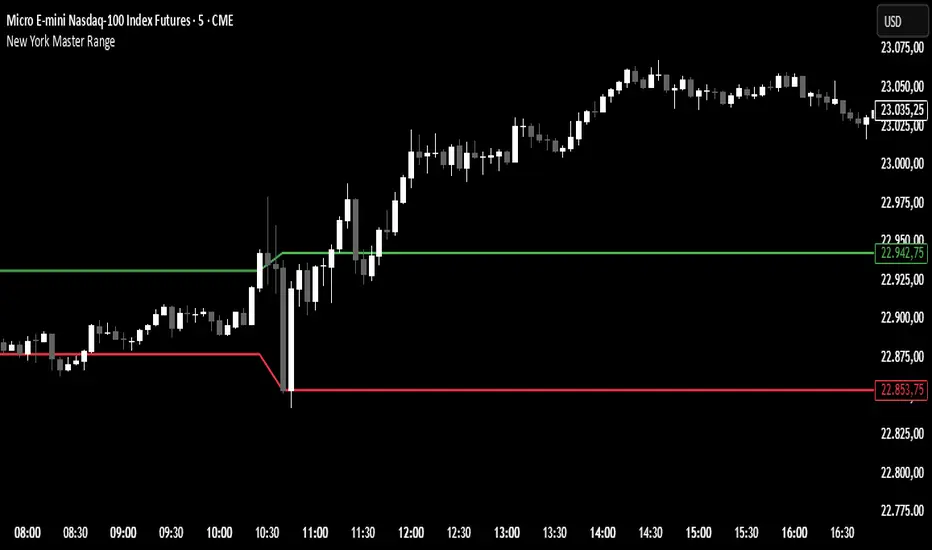
At exactly 10:30 AM (BRT), the indicator starts collecting the highs and lows of candle bodies (not wicks) for the next 3 five-minute candles.
Once the 3 candles are processed, the highest close/open (body high) and lowest close/open (body low) are plotted as static green and red lines on the chart.
These levels can act as key intraday support/resistance zones or range breakout triggers.
Description:
This custom TradingView indicator captures the opening range based on the body high and low of the first 3 candles after 10:30 AM (BRT – Brasília Time) on the 5-minute timeframe — a technique often used during the New York market session.
🔍 How it works:
At exactly 10:30 AM (BRT), the indicator starts collecting the highs and lows of candle bodies (not wicks) for the next 3 five-minute candles.
Once the 3 candles are processed, the highest close/open (body high) and lowest close/open (body low) are plotted as static green and red lines on the chart.
These levels can act as key intraday support/resistance zones or range breakout triggers.
オープンソーススクリプト
TradingViewの精神に則り、このスクリプトの作者はコードをオープンソースとして公開してくれました。トレーダーが内容を確認・検証できるようにという配慮です。作者に拍手を送りましょう!無料で利用できますが、コードの再公開はハウスルールに従う必要があります。
免責事項
この情報および投稿は、TradingViewが提供または推奨する金融、投資、トレード、その他のアドバイスや推奨を意図するものではなく、それらを構成するものでもありません。詳細は利用規約をご覧ください。
オープンソーススクリプト
TradingViewの精神に則り、このスクリプトの作者はコードをオープンソースとして公開してくれました。トレーダーが内容を確認・検証できるようにという配慮です。作者に拍手を送りましょう!無料で利用できますが、コードの再公開はハウスルールに従う必要があります。
免責事項
この情報および投稿は、TradingViewが提供または推奨する金融、投資、トレード、その他のアドバイスや推奨を意図するものではなく、それらを構成するものでもありません。詳細は利用規約をご覧ください。