OPEN-SOURCE SCRIPT
High Liquidity Zones and Threshold Volume
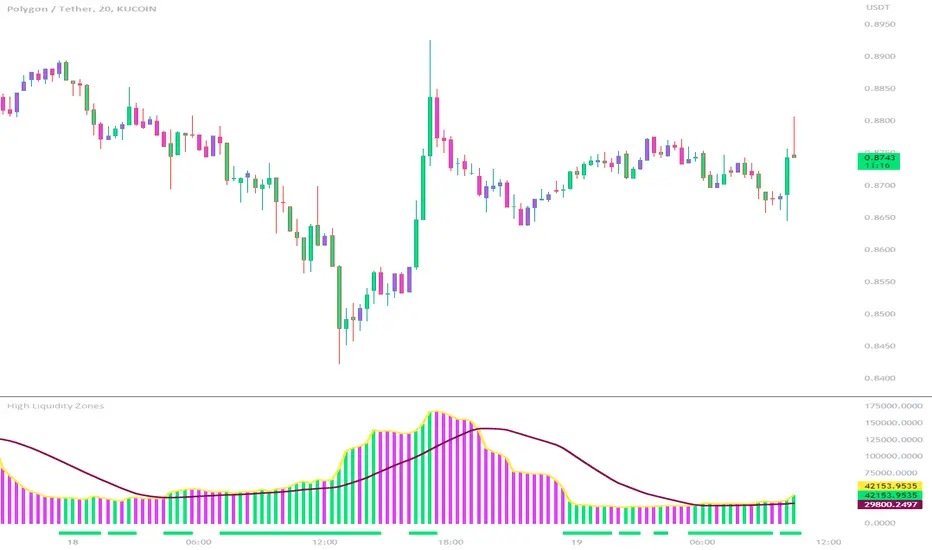
The High Liquidity Zones indicator is designed to identify areas of significant liquidity in the market. It helps traders recognize regions where trading volume is notably higher, indicating potential areas of increased market activity and interest.
The indicator calculates the average volume over a specified lookback period, which can be customized according to individual preferences. This average volume acts as a reference point to determine the threshold volume level. The threshold percentage input allows users to set the sensitivity of the indicator, defining the minimum volume required for an area to be considered a high liquidity zone.
When the current volume surpasses the threshold volume level, the indicator highlights these areas as high liquidity zones. This visual representation allows traders to quickly identify and focus on periods of heightened trading activity. The high liquidity zones are marked with square shapes below the histogram, providing a clear visual indication on the chart.
The first plot line represents the threshold volume level as a histogram, showing the volume levels in relation to the threshold. This histogram helps traders assess the magnitude of the volume in the identified high liquidity zones.
The second plot line represents the threshold volume's simple moving average (SMA) over the lookback period. The SMA acts as a reference line, smoothing out fluctuations in the threshold volume and providing a more stable measure of high liquidity zones. Traders can use this line to better understand the overall trend and dynamics of liquidity.
The High Liquidity Zones indicator offers flexibility, allowing traders to adapt it to their preferred trading style and timeframe. By adjusting the lookback period and threshold percentage, users can fine-tune the sensitivity of the indicator based on their trading strategies and market conditions.
Furthermore, traders can combine the High Liquidity Zones indicator with other technical analysis tools to confirm trading signals or identify areas of potential support and resistance. It can help them locate price levels where market participants have a substantial presence and where significant buying or selling pressure may occur.
Overall, the High Liquidity Zones indicator is a valuable tool for traders seeking to gain insights into market liquidity dynamics. By highlighting areas of intense trading activity, it assists in making informed trading decisions and identifying opportunities within the market.
オープンソーススクリプト
TradingViewの精神に則り、このスクリプトの作者はコードをオープンソースとして公開してくれました。トレーダーが内容を確認・検証できるようにという配慮です。作者に拍手を送りましょう!無料で利用できますが、コードの再公開はハウスルールに従う必要があります。
免責事項
この情報および投稿は、TradingViewが提供または推奨する金融、投資、トレード、その他のアドバイスや推奨を意図するものではなく、それらを構成するものでもありません。詳細は利用規約をご覧ください。
オープンソーススクリプト
TradingViewの精神に則り、このスクリプトの作者はコードをオープンソースとして公開してくれました。トレーダーが内容を確認・検証できるようにという配慮です。作者に拍手を送りましょう!無料で利用できますが、コードの再公開はハウスルールに従う必要があります。
免責事項
この情報および投稿は、TradingViewが提供または推奨する金融、投資、トレード、その他のアドバイスや推奨を意図するものではなく、それらを構成するものでもありません。詳細は利用規約をご覧ください。