OPEN-SOURCE SCRIPT
RV- Intrinsic Value Analyzer
Why These Metrics Matter in IVA Pro (Intrinsic Value Analyzer)?
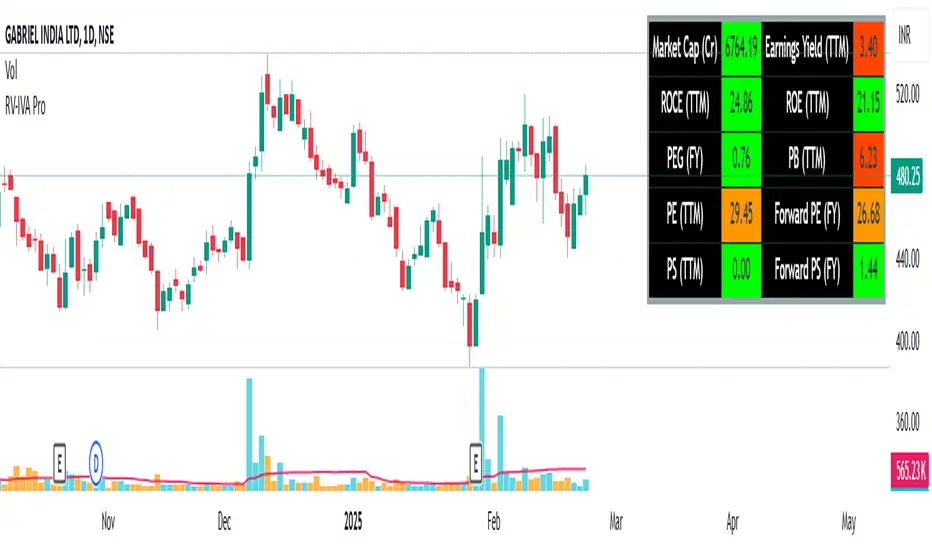
The IVA Pro consolidates key valuation, profitability, and efficiency metrics into a single, easy-to-read table. These indicators provide a comprehensive view of a company’s financial health, helping traders and investors make informed decisions based on growth potential, profitability, and valuation. The color-coded signals (green for strong, orange for moderate, and red for weak values) simplify fundamental analysis and enable quick comparisons across different stocks.
Key Fundamental Parameters in IVA Pro
- Market Capitalization (Market Cap): Measures a company's total market value, helping assess size, stability, and growth potential.
- Earnings Yield (TTM): Indicates how much profit a company generates relative to its stock price—useful for comparing against bonds and other assets.
- Return on Capital Employed (ROCE): Shows how efficiently a company generates profits using its capital—a key profitability metric.
- Return on Equity (ROE): Evaluates how well a company uses shareholder funds to generate earnings.
- Price-to-Earnings Ratio (PE): Helps determine whether a stock is overvalued or undervalued based on earnings.
- Price-to-Book Ratio (PB): Assesses if a stock is trading above or below its net asset value—useful for asset-heavy industries.
- Price-to-Sales Ratio (PS): Helps evaluate revenue potential, particularly for growth-stage companies.
- PEG Ratio: Enhances PE ratio by factoring in earnings growth—ideal for identifying undervalued growth stocks.
- Forward PE Ratio: Provides a future-looking valuation based on projected earnings.
- Forward PS Ratio: Helps evaluate future revenue potential and overall stock valuation.
オープンソーススクリプト
TradingViewの精神に則り、このスクリプトの作者はコードをオープンソースとして公開してくれました。トレーダーが内容を確認・検証できるようにという配慮です。作者に拍手を送りましょう!無料で利用できますが、コードの再公開はハウスルールに従う必要があります。
免責事項
この情報および投稿は、TradingViewが提供または推奨する金融、投資、トレード、その他のアドバイスや推奨を意図するものではなく、それらを構成するものでもありません。詳細は利用規約をご覧ください。
オープンソーススクリプト
TradingViewの精神に則り、このスクリプトの作者はコードをオープンソースとして公開してくれました。トレーダーが内容を確認・検証できるようにという配慮です。作者に拍手を送りましょう!無料で利用できますが、コードの再公開はハウスルールに従う必要があります。
免責事項
この情報および投稿は、TradingViewが提供または推奨する金融、投資、トレード、その他のアドバイスや推奨を意図するものではなく、それらを構成するものでもありません。詳細は利用規約をご覧ください。