OPEN-SOURCE SCRIPT
更新済 VWMA Keltner Bands
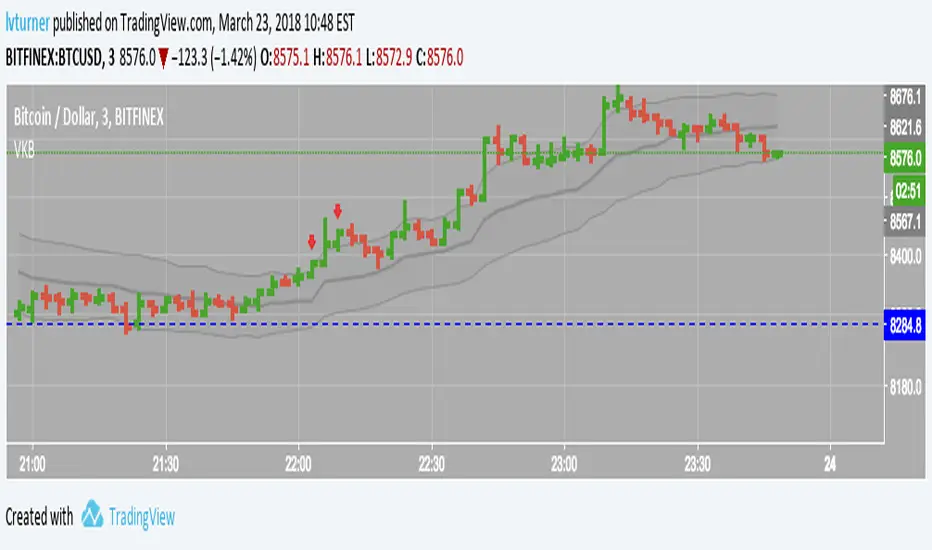
Kind of like Keltner Channel/Bands (stockcharts.com/school/doku.php?id=chart_school:technical_indicators:keltner_channels) but using VWMA instead so that volume is taken in to account.
Outside the upper band can considered to be 'overbought' and outside the lower band can be considered to be 'oversold'
Has option to highlight signals (i.e. when price closes outside a channel) and also the option to only display signals if the price is on the correct side of VWAP (i.e. no sell signals if price is above VWAP)
リリースノート
Removed the signals as honestly, didn't find them that useful as stand alone signals.リリースノート
...aand removed the input options for the no longer existing signals :)オープンソーススクリプト
TradingViewの精神に則り、このスクリプトの作者はコードをオープンソースとして公開してくれました。トレーダーが内容を確認・検証できるようにという配慮です。作者に拍手を送りましょう!無料で利用できますが、コードの再公開はハウスルールに従う必要があります。
免責事項
この情報および投稿は、TradingViewが提供または推奨する金融、投資、トレード、その他のアドバイスや推奨を意図するものではなく、それらを構成するものでもありません。詳細は利用規約をご覧ください。
オープンソーススクリプト
TradingViewの精神に則り、このスクリプトの作者はコードをオープンソースとして公開してくれました。トレーダーが内容を確認・検証できるようにという配慮です。作者に拍手を送りましょう!無料で利用できますが、コードの再公開はハウスルールに従う必要があります。
免責事項
この情報および投稿は、TradingViewが提供または推奨する金融、投資、トレード、その他のアドバイスや推奨を意図するものではなく、それらを構成するものでもありません。詳細は利用規約をご覧ください。