OPEN-SOURCE SCRIPT
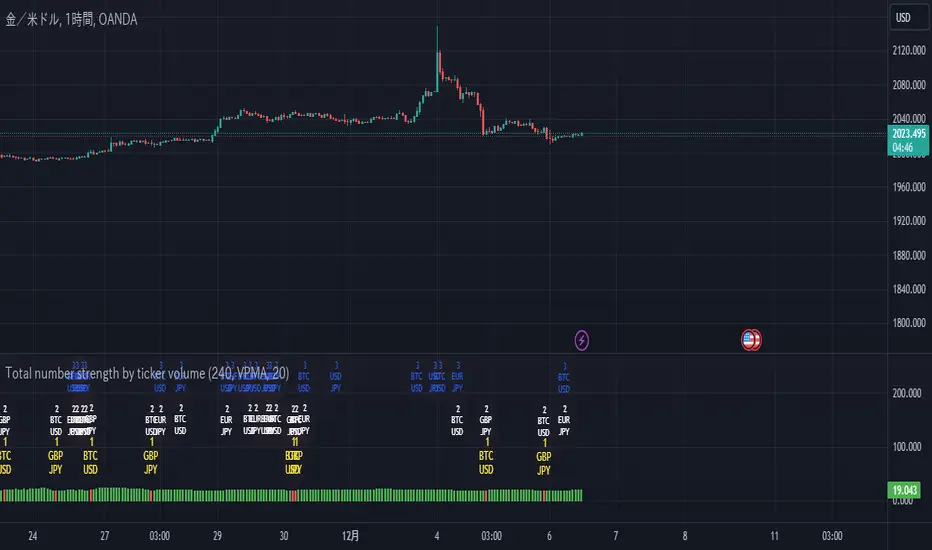
Total number strength by ticker volume
This is about stocks, which I always analyze.
Figure this out by looking at what the code calls ta.secutity.
This indicator plots the highest value of the ratio of total volume to individual volume for the stock you are analyzing, and the histogram tumbles to red when the stock changes in that value. The changed value is plotted as a label above that histogram. By using this indicator, you can determine which is currently the focus of attention, and if there are outliers, you will know by the histogram's detachment.
The parameters are explained below, but Timefream is the market value to be determined
setvalue sets the item to be judged, and lenght sets the time period to be judged. setvalue is the parameter that determines the timeframe for the judgment. vol is the volume, VP is the total purchase price, VPMA is its average, VPMAD is the detachment from its average, MA is the average of the vol, MAD is the detachment from its average, LRC is the average of the vol, and LRC is the average of the vol. value of linear regression, and also
The calculation of detachment is not negative because it comes out as a square, but it is not a problem because it is calculated as a percentage.
There is a *problem, and if the timefreame to be displayed is not calculated below the value of timefreame, an error will occur. We are currently searching for a solution to this problem. If you know the solution, I would appreciate it if you could let me know in the chat.
オープンソーススクリプト
TradingViewの精神に則り、このスクリプトの作者はコードをオープンソースとして公開してくれました。トレーダーが内容を確認・検証できるようにという配慮です。作者に拍手を送りましょう!無料で利用できますが、コードの再公開はハウスルールに従う必要があります。
免責事項
この情報および投稿は、TradingViewが提供または推奨する金融、投資、トレード、その他のアドバイスや推奨を意図するものではなく、それらを構成するものでもありません。詳細は利用規約をご覧ください。
オープンソーススクリプト
TradingViewの精神に則り、このスクリプトの作者はコードをオープンソースとして公開してくれました。トレーダーが内容を確認・検証できるようにという配慮です。作者に拍手を送りましょう!無料で利用できますが、コードの再公開はハウスルールに従う必要があります。
免責事項
この情報および投稿は、TradingViewが提供または推奨する金融、投資、トレード、その他のアドバイスや推奨を意図するものではなく、それらを構成するものでもありません。詳細は利用規約をご覧ください。