OPEN-SOURCE SCRIPT
First 9:15-9:20 Candle Levels (Daily)
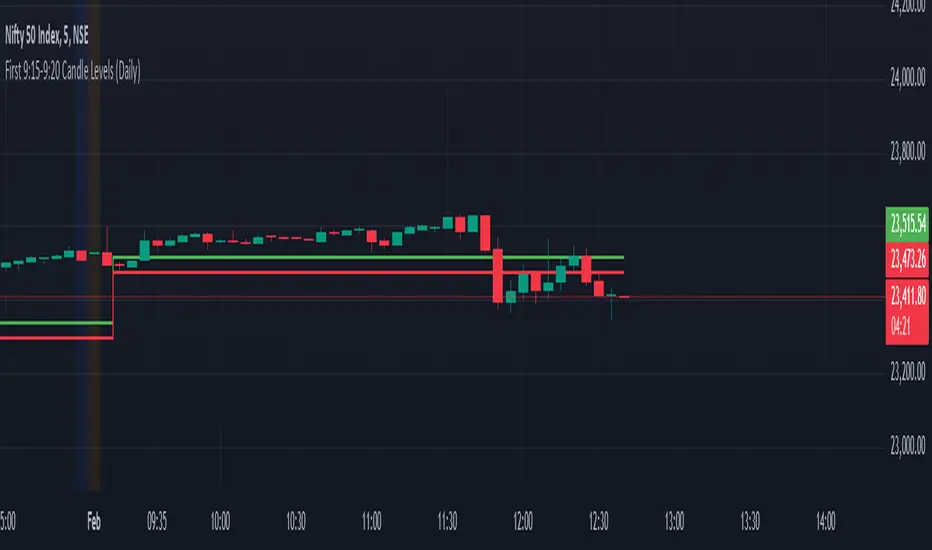
This indicator captures the closing price of the first 5-minute candle (9:15 - 9:20 AM) every trading day. It then calculates 0.09% above and below this closing price and plots horizontal lines. The indicator resets daily at 9:15 AM, ensuring it always tracks the latest market open. After 9:20 AM, the calculated levels remain visible throughout the day. The upper level is displayed in green, while the lower level is in red. This tool helps traders identify key price levels early in the session, useful for setting stop-losses, take-profit zones, or identifying potential breakout points.
オープンソーススクリプト
TradingViewの精神に則り、このスクリプトの作者はコードをオープンソースとして公開してくれました。トレーダーが内容を確認・検証できるようにという配慮です。作者に拍手を送りましょう!無料で利用できますが、コードの再公開はハウスルールに従う必要があります。
免責事項
この情報および投稿は、TradingViewが提供または推奨する金融、投資、トレード、その他のアドバイスや推奨を意図するものではなく、それらを構成するものでもありません。詳細は利用規約をご覧ください。
オープンソーススクリプト
TradingViewの精神に則り、このスクリプトの作者はコードをオープンソースとして公開してくれました。トレーダーが内容を確認・検証できるようにという配慮です。作者に拍手を送りましょう!無料で利用できますが、コードの再公開はハウスルールに従う必要があります。
免責事項
この情報および投稿は、TradingViewが提供または推奨する金融、投資、トレード、その他のアドバイスや推奨を意図するものではなく、それらを構成するものでもありません。詳細は利用規約をご覧ください。