934
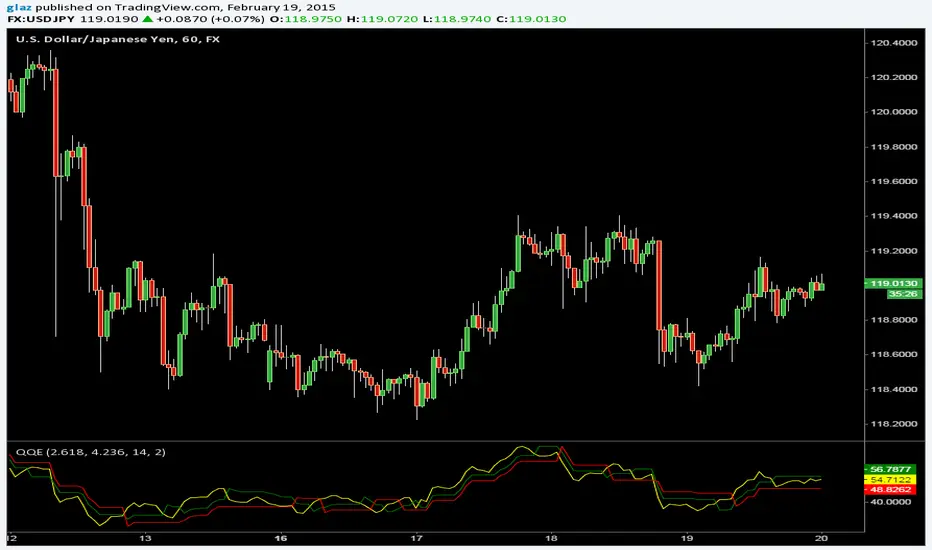
The Metastock version of Quantative Qualitative Estimation with two trailing stop lines and more options
Yellow line can be hidden if its too many signals and expirement with the Slow/Fast Trailing stop lines.
オープンソーススクリプト

TradingViewの精神に則り、このスクリプトの作者は、トレーダーが理解し検証できるようにオープンソースで公開しています。作者に敬意を表します!無料で使用することができますが、このコードを投稿で再利用するには、ハウスルールに準拠する必要があります。 お気に入りに登録してチャート上でご利用頂けます。

免責事項

これらの情報および投稿は、TradingViewが提供または保証する金融、投資、取引、またはその他の種類のアドバイスや推奨を意図したものではなく、またそのようなものでもありません。詳しくは利用規約をご覧ください。

チャートでこのスクリプトを利用したいですか?
//By Glaz Metastock Version of QQE
study("QQE")
src=close
Fast=input(2.6180)
Slow=input(4.2360)
RSI=input(14)
SF=input(2,title='Slow Factor')
WiMA(src, length) => 
    MA_s=(src + nz(MA_s[1] * (length-1)))/length
    MA_s

RSIndex= ema(rsi(close,RSI), SF)

//{Smoothed ATR of Smoothed RSI}
TH= iff(RSIndex[1] > RSIndex, RSIndex[1], RSIndex)
TL= iff(RSIndex[1] < RSIndex, RSIndex[1], RSIndex)
TR= TH-TL

AtrRsi= WiMA(TR, 14)
SmoothedAtrRsi= WiMA(AtrRsi, 14)

//{Fast and Slow ATR Trailing Levels} 

DeltaFastAtrRsi= SmoothedAtrRsi*Fast

newshortband=  RSIndex + DeltaFastAtrRsi
newlongband= RSIndex - DeltaFastAtrRsi
longband=RSIndex[1] > longband[1] and RSIndex > longband[1]?
 max(longband[1],newlongband):newlongband
shortband=RSIndex[1] < shortband[1] and  RSIndex < shortband[1]?
 min(shortband[1], newshortband):newshortband
trend=cross(RSIndex, shortband[1])?1:cross(longband[1], RSIndex)?-1:nz(trend[1],1)
FastAtrRsiTL = trend==1? longband: shortband

DeltaSlowAtrRsi= SmoothedAtrRsi*Slow

newshortband1=  RSIndex + DeltaSlowAtrRsi
newlongband1= RSIndex - DeltaSlowAtrRsi

longband1=RSIndex[1] > longband1[1] and RSIndex > longband1[1]?
 max(longband1[1],newlongband1):newlongband1
shortband1=RSIndex[1] < shortband1[1] and  RSIndex < shortband1[1]?
 min(shortband1[1], newshortband1):newshortband1

trend1=cross(RSIndex, shortband1[1])?1:cross(longband1[1], RSIndex)?-1:nz(trend1[1],1)
SlowAtrRsiTL= trend1==1? longband1: shortband1

plot(RSIndex,title="RSIndex",color=yellow)
plot(FastAtrRsiTL,title="FastAtrRSI",color=green)
plot(SlowAtrRsiTL,title="SlowAtrRSI",color=red)