OPEN-SOURCE SCRIPT
更新済 Stop Loss Indicator
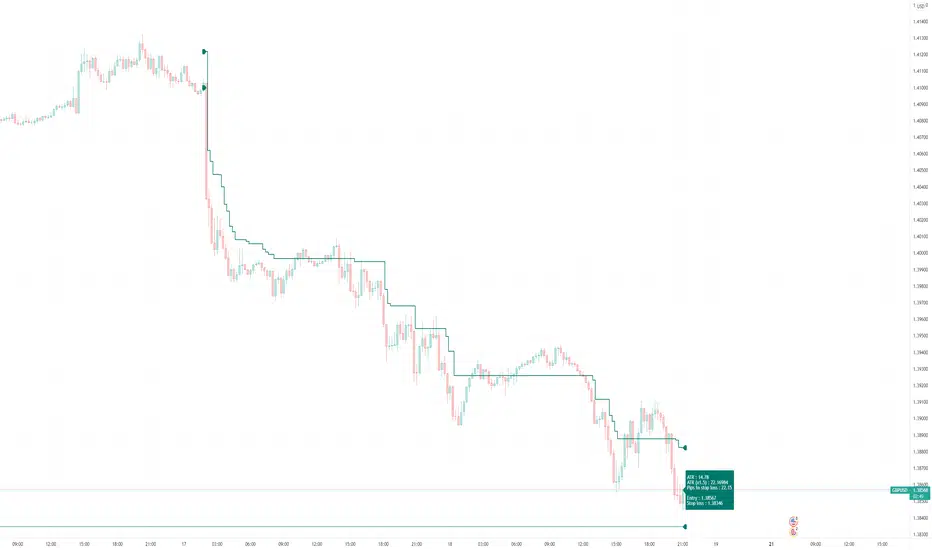
The stop loss indicator is a single trade indicator to manage risk
It tells you the size of the trade you should enter and lets you know where to place stops and when and where to trail your stops to based on ATR, given your entry price and risk amount.
Set the date and time once trade is active and once ATR moves above(long)/below(short) entry price you can move your stop loss following the green triangles.
Short
green triangle down => high + (ATR * 1.5)
red triangle up => low + (ATR * 1.5)
Long
green triangle up => low - (ATR * 1.5)
red triangle down => high - (ATR * 1.5)
リリースノート
Improved and clearer visualization of stop loss hover on end stop loss label for more details
リリースノート
Fixed 15 min positioningオープンソーススクリプト
TradingViewの精神に則り、このスクリプトの作者はコードをオープンソースとして公開してくれました。トレーダーが内容を確認・検証できるようにという配慮です。作者に拍手を送りましょう!無料で利用できますが、コードの再公開はハウスルールに従う必要があります。
免責事項
この情報および投稿は、TradingViewが提供または推奨する金融、投資、トレード、その他のアドバイスや推奨を意図するものではなく、それらを構成するものでもありません。詳細は利用規約をご覧ください。
オープンソーススクリプト
TradingViewの精神に則り、このスクリプトの作者はコードをオープンソースとして公開してくれました。トレーダーが内容を確認・検証できるようにという配慮です。作者に拍手を送りましょう!無料で利用できますが、コードの再公開はハウスルールに従う必要があります。
免責事項
この情報および投稿は、TradingViewが提供または推奨する金融、投資、トレード、その他のアドバイスや推奨を意図するものではなく、それらを構成するものでもありません。詳細は利用規約をご覧ください。