INVITE-ONLY SCRIPT
更新済 The Multi Touch Confluence Indicator Subplot
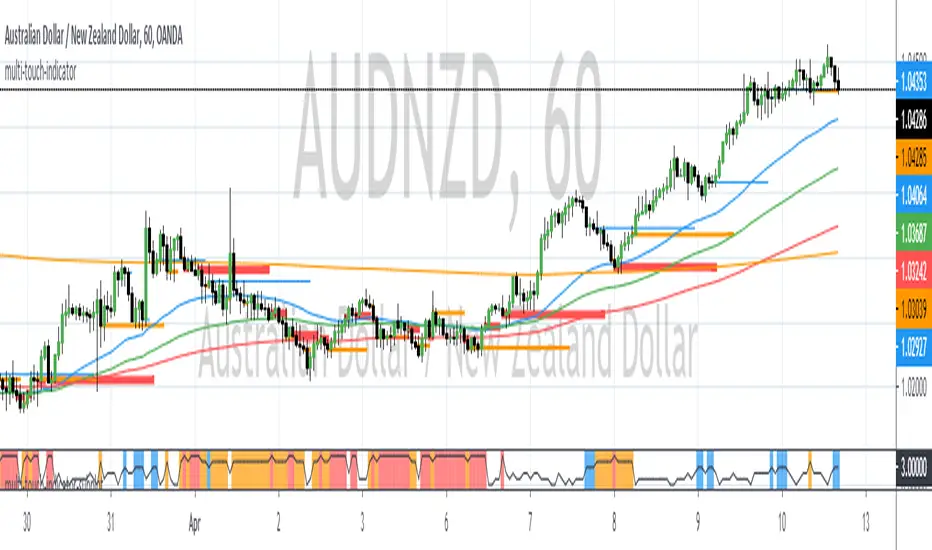
The Multi Touch EMA Confluence Indicator Subplot identifies zones where EMAs across 6 different time frames are within a specified range in proximity of the close value. These zones indicate confluence of EMAs.
The confluence zone is specified as a point difference.
When confluence is found, the indicator will paint vertical lines of different color and width.
The maximum number of time frames being used is 6.
The maximum number of EMAs per time frame is 4.
When confluence occurs it usually indicates a precursor of price expansion. This indicator can be used to determine when momentum is about to come back into the market.
The confluence zone is specified as a point difference.
When confluence is found, the indicator will paint vertical lines of different color and width.
- Blue Zones indicate a confluence of 3 EMAs across all time frames
- Orange Zones indicate a confluence of 4 EMAs across all time frames
- Red Zones indicate a confluence of 5 or more EMAs across all time frames.
The maximum number of time frames being used is 6.
The maximum number of EMAs per time frame is 4.
When confluence occurs it usually indicates a precursor of price expansion. This indicator can be used to determine when momentum is about to come back into the market.
リリースノート
fix: Refined confluence algorithm thresholds. 招待専用スクリプト
このスクリプトは作者が承認したユーザーのみアクセス可能です。使用するにはアクセス申請をして許可を得る必要があります。通常は支払い後に承認されます。詳細は下記の作者の指示に従うか、LiquidityTrackerに直接お問い合わせください。
TradingViewは、作者を完全に信頼し、スクリプトの動作を理解していない限り、有料スクリプトの購入・使用を推奨しません。コミュニティスクリプトには無料のオープンソースの代替が多数あります。
作者の指示
免責事項
この情報および投稿は、TradingViewが提供または推奨する金融、投資、トレード、その他のアドバイスや推奨を意図するものではなく、それらを構成するものでもありません。詳細は利用規約をご覧ください。
招待専用スクリプト
このスクリプトは作者が承認したユーザーのみアクセス可能です。使用するにはアクセス申請をして許可を得る必要があります。通常は支払い後に承認されます。詳細は下記の作者の指示に従うか、LiquidityTrackerに直接お問い合わせください。
TradingViewは、作者を完全に信頼し、スクリプトの動作を理解していない限り、有料スクリプトの購入・使用を推奨しません。コミュニティスクリプトには無料のオープンソースの代替が多数あります。
作者の指示
免責事項
この情報および投稿は、TradingViewが提供または推奨する金融、投資、トレード、その他のアドバイスや推奨を意図するものではなく、それらを構成するものでもありません。詳細は利用規約をご覧ください。