OPEN-SOURCE SCRIPT
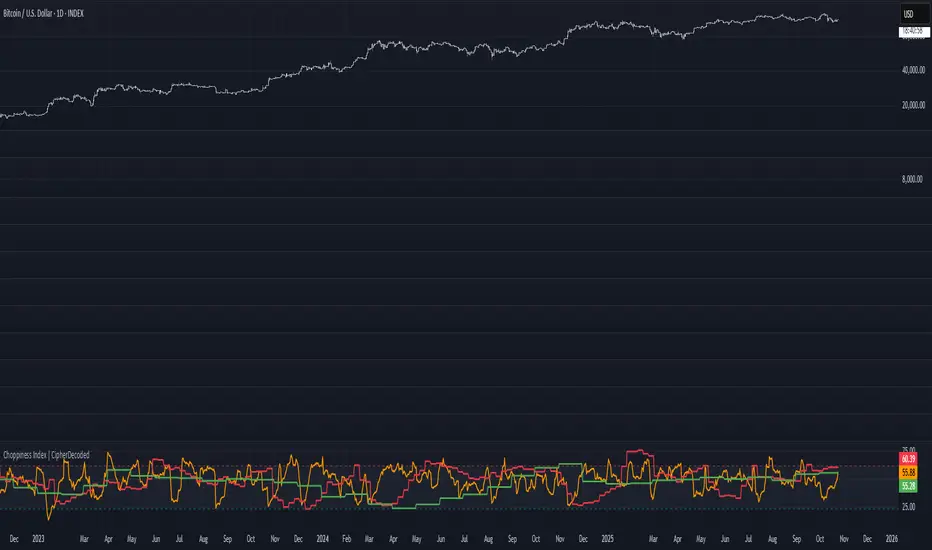
Choppiness Index | CipherDecoded

The Choppiness Index is a multi-timeframe regime indicator that measures whether price action is trending or consolidating.
This recreation was inspired by the Choppiness Index chart from Checkonchain, with full credit to their team for the idea.
🔹How It Works
Pine Script®
Where:
Below is a simplified function used in the script for computing CI on any timeframe:
Pine Script®
🔹Example Background Logic
Pine Script®
🔹Usage Tips
🔹 Disclaimer
This indicator is provided for educational purposes.
No trading outcomes are guaranteed.
This tool does not guarantee market turns or performance; it should be used as part of a broader system.
Use responsibly and perform your own testing.
🔹 Credits
Concept origin — Checkonchain Choppiness Index
This recreation was inspired by the Choppiness Index chart from Checkonchain, with full credit to their team for the idea.
🔹How It Works
CI = 100 * log10( SUM(ATR(1), n) / (highest(high, n) – lowest(low, n)) ) / log10(n)
Where:
- n – lookback length (e.g. 14 days / 10 weeks / 10 months)
- ATR(1) – true-range of each bar
- SUM(ATR(1), n) – total true-range over n bars
- highest(high, n) and lowest(low, n) – price range over n bars
- Low values → strong trend
- High values → sideways consolidation
Below is a simplified function used in the script for computing CI on any timeframe:
f_ci(_n) =>
_tr = ta.tr(true)
_sum = math.sum(_tr, _n)
_hh = ta.highest(high, _n)
_ll = ta.lowest(low, _n)
_rng = _hh - _ll
_rng > 0 ? 100 * math.log10(_sum / _rng) / math.log10(_n) : na
- Consolidation Threshold — 50.0
- Trend Threshold — 38.2
- When Weekly CI < Trend Threshold, a trending zone (yellow) appears.
- When Weekly CI > Consolidation Threshold, a consolidation zone (purple) appears.
- Users can toggle either background independently.
🔹Example Background Logic
bgcolor(isTrend and Trend ? color.new(#f3e459, 50) : na, title = "Trending", force_overlay = true)
bgcolor(isConsol and Cons ? color.new(#974aa5, 50) : na, title = "Consolidation", force_overlay = true)
🔹Usage Tips
- Observe the Weekly CI for regime context.
- Combine with price structure or trend filters for signal confirmation.
- Low CI values (< 38) indicate strong trend activity — the market may soon consolidate to reset.
- High CI values (> 60) reflect sideways or range-bound conditions — the market is recharging before a potential new trend.
🔹 Disclaimer
This indicator is provided for educational purposes.
No trading outcomes are guaranteed.
This tool does not guarantee market turns or performance; it should be used as part of a broader system.
Use responsibly and perform your own testing.
🔹 Credits
Concept origin — Checkonchain Choppiness Index
オープンソーススクリプト
TradingViewの精神に則り、このスクリプトの作者はコードをオープンソースとして公開してくれました。トレーダーが内容を確認・検証できるようにという配慮です。作者に拍手を送りましょう!無料で利用できますが、コードの再公開はハウスルールに従う必要があります。
免責事項
この情報および投稿は、TradingViewが提供または推奨する金融、投資、トレード、その他のアドバイスや推奨を意図するものではなく、それらを構成するものでもありません。詳細は利用規約をご覧ください。
オープンソーススクリプト
TradingViewの精神に則り、このスクリプトの作者はコードをオープンソースとして公開してくれました。トレーダーが内容を確認・検証できるようにという配慮です。作者に拍手を送りましょう!無料で利用できますが、コードの再公開はハウスルールに従う必要があります。
免責事項
この情報および投稿は、TradingViewが提供または推奨する金融、投資、トレード、その他のアドバイスや推奨を意図するものではなく、それらを構成するものでもありません。詳細は利用規約をご覧ください。