OPEN-SOURCE SCRIPT
UpVol/TVol NYSE Lowry Upside Days
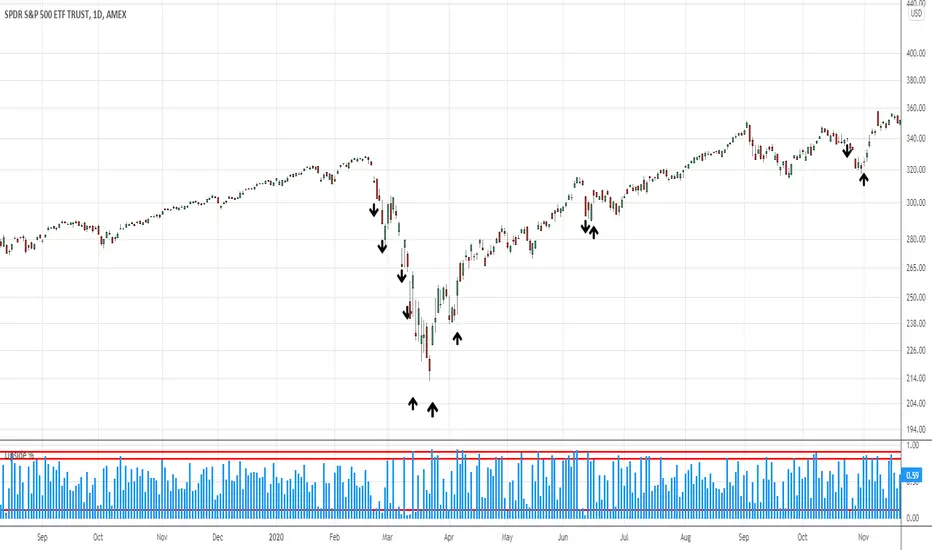
Takes Tradingviews Upside Volume for NYSE and divides it by Total Volume on NYSE.
Tradingview's data source generally has different volume figures than say the Wall Street Journal. Therefore, this indicator is an estimate.
10% upside volume shows extreme panic and is consistent with market sell offs.
90% upside days, following a decline, are often occur within a week or so of significant market bottoms.
Recommend using columns as the plot type.
Based on research of LowryResearch Corp.
オープンソーススクリプト
TradingViewの精神に則り、このスクリプトの作者はコードをオープンソースとして公開してくれました。トレーダーが内容を確認・検証できるようにという配慮です。作者に拍手を送りましょう!無料で利用できますが、コードの再公開はハウスルールに従う必要があります。
Cory Mitchell, CMT
Stock and forex trading insights at tradethatswing.com/
Stock and forex trading insights at tradethatswing.com/
免責事項
この情報および投稿は、TradingViewが提供または推奨する金融、投資、トレード、その他のアドバイスや推奨を意図するものではなく、それらを構成するものでもありません。詳細は利用規約をご覧ください。