OPEN-SOURCE SCRIPT
HTF & PD/PM Levels
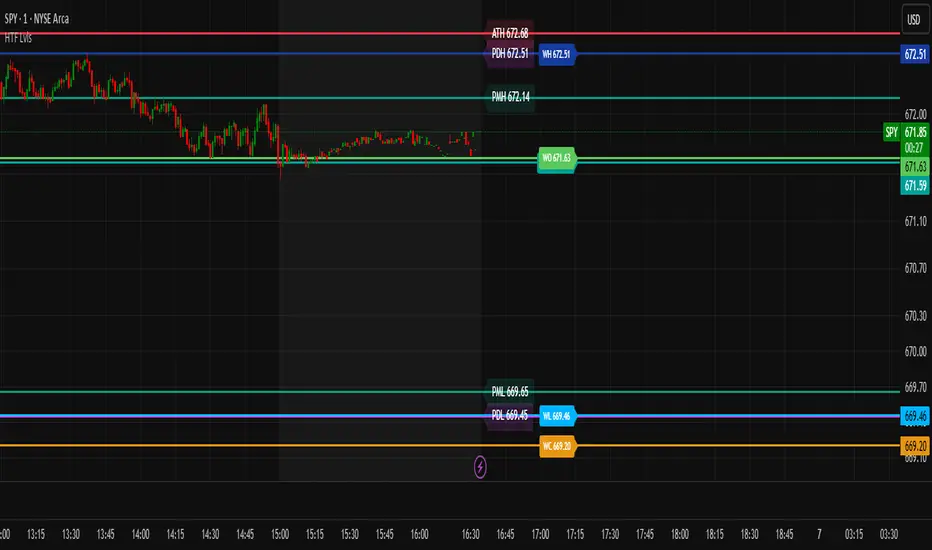
Tired of mapping your own levels every morning? Look no further! This script automatically maps out and updates HTF & PD/PM Levels along with ATH. I personally use these as confirmation zones with EMA & VWAP, RSI, and Volume... but alone, these levels mark major support and resistances.
What are they?
🏰 HTF Levels — “Big Grown-Up Lines”
HTF = Higher Time Frame
Think of your price chart like a big map. HTF levels are the important lines from bigger chunks of time:
>Daily (yesterday’s close, high, low)
>Weekly (this week’s open, high, low, close)
>Monthly (this month’s open/close)
Why they matter:
These are like big walls and floors that price often bounces off or stops at. Big traders (institutions) watch them because they show where a lot of buying or selling happened before.
⏰ PD & PM Levels — “Yesterday & Morning Clues”
PD = Previous Day
>PDH = Previous Day’s High
>PDL = Previous Day’s Low
>PDC = Previous Day’s Close
PM = Pre-Market
>PMH = Pre-Market High
>PML = Pre-Market Low
>ATH = All-Time High
Why they matter:
These tell you where price moved when most regular traders weren’t awake yet (pre-market) and where it ended up yesterday. Price often revisits or reacts to these spots.
⚡ How Options Traders Use Them
Support & Resistance:
If price is near an HTF or PD/PM level, it might stop and turn around there (like a ball hitting a wall) or it might use it as a launchpad to the next level if it breaks.
Entry & Exit Spots:
Traders might buy calls (bet price goes up) if it breaks above an important level, or puts (bet price goes down) if it breaks below.
Risk Management:
These levels give clear spots to set stops and targets — “If price breaks this level, I’m out.”
Super Simple Picture:
HTF = big important levels from days, weeks, months.
PD/PM = yesterday’s and morning’s clues where price already moved.
Traders use them to guess where price might bounce or break to plan option trades safely.
オープンソーススクリプト
TradingViewの精神に則り、このスクリプトの作者はコードをオープンソースとして公開してくれました。トレーダーが内容を確認・検証できるようにという配慮です。作者に拍手を送りましょう!無料で利用できますが、コードの再公開はハウスルールに従う必要があります。
免責事項
この情報および投稿は、TradingViewが提供または推奨する金融、投資、トレード、その他のアドバイスや推奨を意図するものではなく、それらを構成するものでもありません。詳細は利用規約をご覧ください。
オープンソーススクリプト
TradingViewの精神に則り、このスクリプトの作者はコードをオープンソースとして公開してくれました。トレーダーが内容を確認・検証できるようにという配慮です。作者に拍手を送りましょう!無料で利用できますが、コードの再公開はハウスルールに従う必要があります。
免責事項
この情報および投稿は、TradingViewが提供または推奨する金融、投資、トレード、その他のアドバイスや推奨を意図するものではなく、それらを構成するものでもありません。詳細は利用規約をご覧ください。