OPEN-SOURCE SCRIPT
更新済 Candle Percentage Change
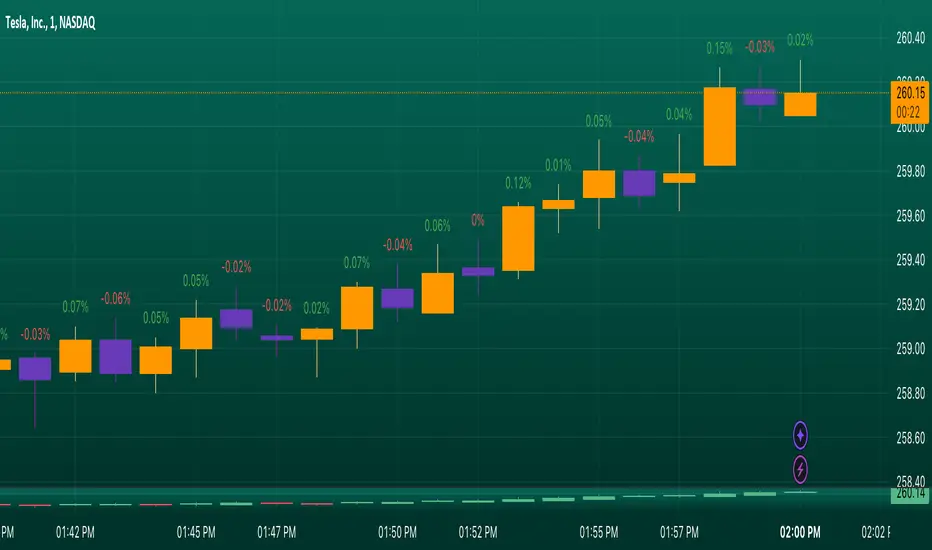
ndicator Setup: The script creates an indicator that overlays on the price chart.
Percentage Calculation: It calculates the percentage change between the current and previous candle closes.
Percentage Calculation: It calculates the percentage change between the current and previous candle closes.
リリースノート
Key Features:Percentage Change Calculation:
The script calculates the percentage change between the closing price of the current candle and the previous candle.
The text color of the percentage change is determined based on the direction of the candle:
Green for bullish candles (close > open).
Red for bearish candles (close < open).
Label Positioning:
The percentage change label is positioned slightly above the high of each candle to ensure visibility and avoid overlap with the candle body.
The label uses the syminfo.mintick variable to maintain appropriate spacing based on the instrument's tick size.
Label Creation:
A new label is created for each candle, displaying the calculated percentage change as text.
The label has a transparent background for a cleaner appearance on the chart.
Usage:
This indicator can be added to any price chart in TradingView. It allows traders to assess price movements quickly, identify trends, and make informed trading decisions based on recent price changes.
Example of Use:
A trader looking at a candlestick chart can easily spot how much the price has changed between each candle. For instance, a label showing "+2.35%" indicates a 2.35% increase from the previous close, while "-1.20%" indicates a 1.20% decrease.
This script is particularly useful for day traders, swing traders, and anyone interested in analyzing price action with a clear visual representation of percentage changes in the market.
リリースノート
Indicator Setup: The script creates an indicator that overlays on the price chart.Percentage Calculation: It calculates the percentage change between the current and previous candle closes.
Key Features:
Percentage Change Calculation:
The script calculates the percentage change between the closing price of the current candle and the previous candle.
The text color of the percentage change is determined based on the direction of the candle:
Green for bullish candles (close > open).
Red for bearish candles (close < open).
Usage:
This indicator can be added to any price chart in TradingView. It allows traders to assess price movements quickly, identify trends, and make informed trading decisions based on recent price changes.
Example of Use:
A trader looking at a candlestick chart can easily spot how much the price has changed between each candle. For instance, a label showing "+2.35%" indicates a 2.35% increase from the previous close, while "-1.20%" indicates a 1.20% decrease.
This script is particularly useful for day traders, swing traders, and anyone interested in analyzing price action with a clear visual representation of percentage changes in the market.
リリースノート
Label overlapping issues fixed.リリースノート
Label position fixedオープンソーススクリプト
TradingViewの精神に則り、このスクリプトの作者はコードをオープンソースとして公開してくれました。トレーダーが内容を確認・検証できるようにという配慮です。作者に拍手を送りましょう!無料で利用できますが、コードの再公開はハウスルールに従う必要があります。
免責事項
この情報および投稿は、TradingViewが提供または推奨する金融、投資、トレード、その他のアドバイスや推奨を意図するものではなく、それらを構成するものでもありません。詳細は利用規約をご覧ください。
オープンソーススクリプト
TradingViewの精神に則り、このスクリプトの作者はコードをオープンソースとして公開してくれました。トレーダーが内容を確認・検証できるようにという配慮です。作者に拍手を送りましょう!無料で利用できますが、コードの再公開はハウスルールに従う必要があります。
免責事項
この情報および投稿は、TradingViewが提供または推奨する金融、投資、トレード、その他のアドバイスや推奨を意図するものではなく、それらを構成するものでもありません。詳細は利用規約をご覧ください。