OPEN-SOURCE SCRIPT
更新済 Upside Downside Unchanged Volume

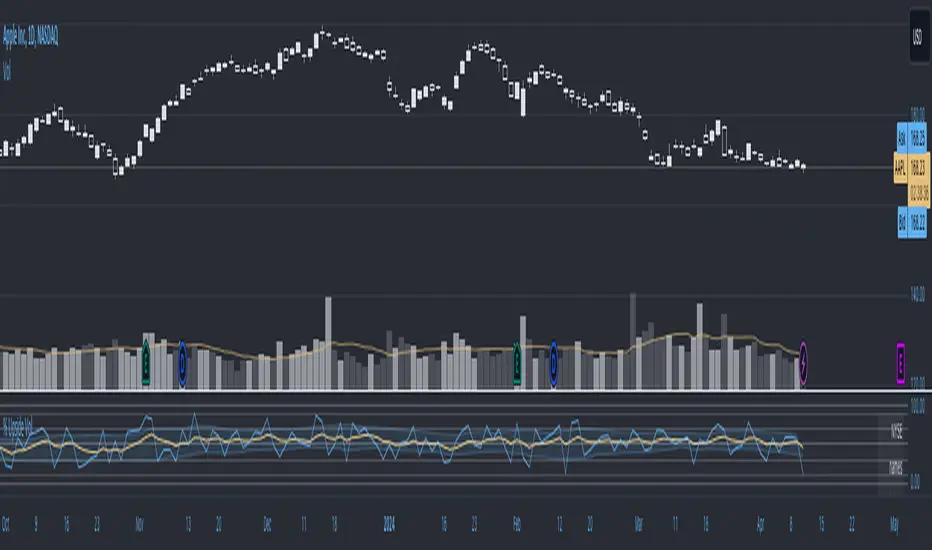
Upside Downside Unchanged Volume
- Plot NYSE or NASDAQ Upside Volume, Downside Volume, or Unchanged Volume (e.g. UPVOL.NY, UVOL, or ADVN.NY) as a percent (values 0 to 1, where 1 = 100%) of Total Volume.
- Plot Day, Week, and Month volume and/or chart timeframe period volume.
- Plot volume as a histogram, line, or area.
- Plot various moving averages of volume points.
- Horizontal lines at 0, 10, 30, 50, 70, 90, and 100% levels.
- Inspired by Paul Desmond of Lowry’s Reports.
リリースノート
Updated script notes:- Plot NYSE or NASDAQ Upside Volume, Downside Volume, or Unchanged Volume as a percent of Total Volume.
- Values are plotted 0 to 1, where 1 = 100%.
- Example of variables: USI:UPVOL.NY/DNVOL.NY/UNCHVOL.NY vs USI:TVOL.NY (Volume), USI:UVOL/DVOL/XVOL vs USI:TVOL (Volume), and USI:ADVN.NY/DECL.NY/UNCH.NY vs USI:ACTV.NY (Issues)
- Plot Day, Week, and Month volume and/or chart timeframe period volume.
- Plot volume as a histogram, line, or area.
- Plot various moving averages of volume points.
- Horizontal lines at 0, .10, .30, .50, .70, .90, and 1.00 levels.
- Inspired by Paul Desmond of Lowry’s Reports.
リリースノート
Added moving averages from values above or below a specified % of total volume.リリースノート
Changed settings titlesリリースノート
Added notes.リリースノート
fixed errorsリリースノート
Edited section headingsリリースノート
added a table to report the current percent up or downリリースノート
edited tableリリースノート
changed colors and defaultsリリースノート
Corrected an error in the code.オープンソーススクリプト
TradingViewの精神に則り、このスクリプトの作者はコードをオープンソースとして公開してくれました。トレーダーが内容を確認・検証できるようにという配慮です。作者に拍手を送りましょう!無料で利用できますが、コードの再公開はハウスルールに従う必要があります。
免責事項
この情報および投稿は、TradingViewが提供または推奨する金融、投資、トレード、その他のアドバイスや推奨を意図するものではなく、それらを構成するものでもありません。詳細は利用規約をご覧ください。
オープンソーススクリプト
TradingViewの精神に則り、このスクリプトの作者はコードをオープンソースとして公開してくれました。トレーダーが内容を確認・検証できるようにという配慮です。作者に拍手を送りましょう!無料で利用できますが、コードの再公開はハウスルールに従う必要があります。
免責事項
この情報および投稿は、TradingViewが提供または推奨する金融、投資、トレード、その他のアドバイスや推奨を意図するものではなく、それらを構成するものでもありません。詳細は利用規約をご覧ください。