OPEN-SOURCE SCRIPT
Price Outpaces Moving Average
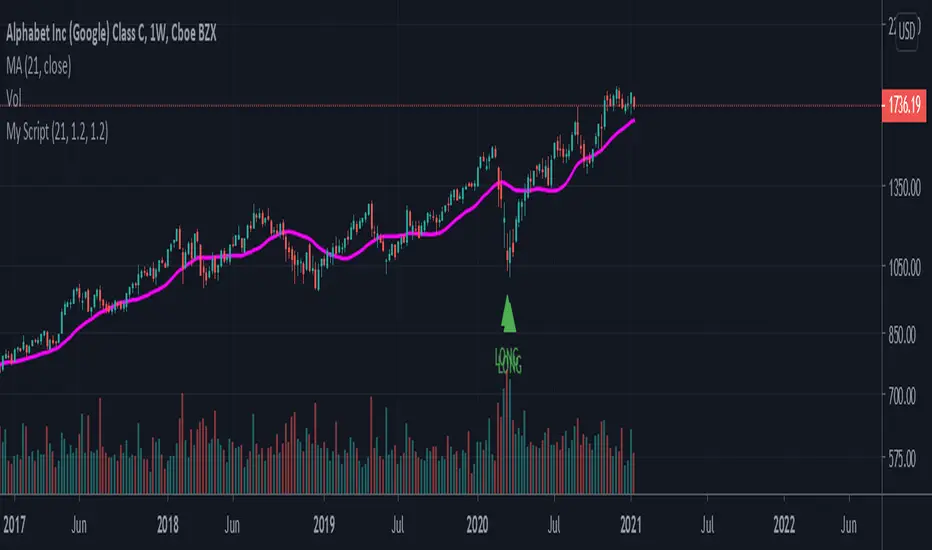
With inputs for the moving average, Bullish overshoot percentage, and bearish overshoot percentage, this indicator is attempting to show market tops based on the difference between the current price of an asset and how far away it is from its moving average.
If you have the bullish overshoot percentage set to 1.5:
let's say price is currently at 20,000 and the moving average is around 6500.
The script calculates 20,000/6500 = 3.07
Then, there is a boolean comparison asking if 3.07 > 1.5.
Since it is, the script will create a "SHORT" flag above that candlestick.
A similar process happens for the "LONG" flags.
オープンソーススクリプト
TradingViewの精神に則り、このスクリプトの作者はコードをオープンソースとして公開してくれました。トレーダーが内容を確認・検証できるようにという配慮です。作者に拍手を送りましょう!無料で利用できますが、コードの再公開はハウスルールに従う必要があります。
免責事項
この情報および投稿は、TradingViewが提供または推奨する金融、投資、トレード、その他のアドバイスや推奨を意図するものではなく、それらを構成するものでもありません。詳細は利用規約をご覧ください。
オープンソーススクリプト
TradingViewの精神に則り、このスクリプトの作者はコードをオープンソースとして公開してくれました。トレーダーが内容を確認・検証できるようにという配慮です。作者に拍手を送りましょう!無料で利用できますが、コードの再公開はハウスルールに従う必要があります。
免責事項
この情報および投稿は、TradingViewが提供または推奨する金融、投資、トレード、その他のアドバイスや推奨を意図するものではなく、それらを構成するものでもありません。詳細は利用規約をご覧ください。