OPEN-SOURCE SCRIPT
更新済 Multi Bollinger Bands with Background Fill
Multi Bollinger Bands with Background Fill
多組帶狀背景布林通道
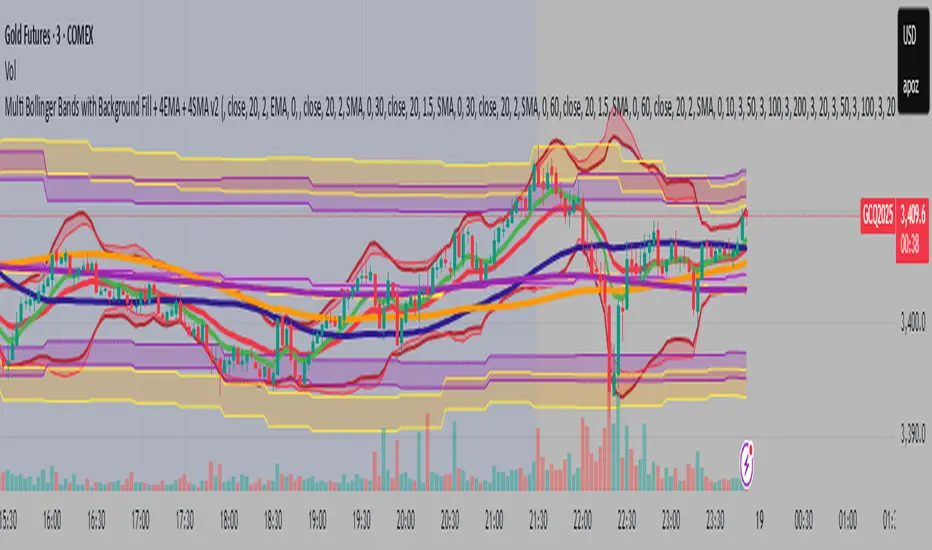
This indicator plots six independent Bollinger Bands channels on the price chart, each fully configurable with customizable period length, standard deviation, and colors for upper, lower, and middle bands. Users can choose to display or hide each channel and its middle band independently.
A distinctive feature of this tool is the option to enable colored background fills between paired Bollinger Bands (channels 1&2, 3&4, and 5&6) to visually highlight volatility zones, improving the clarity of price action and aiding in multi-timeframe volatility analysis.
Key Features:
Six independent Bollinger Bands channels with separate visibility toggles.
Adjustable length and standard deviation for each channel.
Option to display or hide the middle band (basis) for each channel.
Unique colored background fills between paired upper and lower bands for enhanced visual interpretation.
Custom color settings for each band and background for better differentiation.
This indicator is designed for traders looking for advanced multi-layered volatility insights and clearer visual guidance when analyzing price behavior across different timeframes. It is suitable for various trading strategies including trend analysis and volatility-based setups.
多組帶狀背景布林通道
This indicator plots six independent Bollinger Bands channels on the price chart, each fully configurable with customizable period length, standard deviation, and colors for upper, lower, and middle bands. Users can choose to display or hide each channel and its middle band independently.
A distinctive feature of this tool is the option to enable colored background fills between paired Bollinger Bands (channels 1&2, 3&4, and 5&6) to visually highlight volatility zones, improving the clarity of price action and aiding in multi-timeframe volatility analysis.
Key Features:
Six independent Bollinger Bands channels with separate visibility toggles.
Adjustable length and standard deviation for each channel.
Option to display or hide the middle band (basis) for each channel.
Unique colored background fills between paired upper and lower bands for enhanced visual interpretation.
Custom color settings for each band and background for better differentiation.
This indicator is designed for traders looking for advanced multi-layered volatility insights and clearer visual guidance when analyzing price behavior across different timeframes. It is suitable for various trading strategies including trend analysis and volatility-based setups.
リリースノート
New FeaturesIndependent EMA / SMA Selection for Each Bollinger Band
Each of the 6 Bollinger Bands can now individually use either SMA or EMA as the basis line via a dropdown menu (switch type).
8 Fully Customizable Moving Averages
Added support for plotting:
4 EMAs and 4 SMAs, each with customizable:
Visibility (On/Off)
Length
Color
Line Width
リリースノート
Bug fixed All in English
リリースノート
Bug fixedリリースノート
Based on TradingView official Bollinger Bands, 1. Additional Bollinger Band Calculation Methods
2. Timeframe Selection for Each Channel
オープンソーススクリプト
TradingViewの精神に則り、このスクリプトの作者はコードをオープンソースとして公開してくれました。トレーダーが内容を確認・検証できるようにという配慮です。作者に拍手を送りましょう!無料で利用できますが、コードの再公開はハウスルールに従う必要があります。
免責事項
この情報および投稿は、TradingViewが提供または推奨する金融、投資、トレード、その他のアドバイスや推奨を意図するものではなく、それらを構成するものでもありません。詳細は利用規約をご覧ください。
オープンソーススクリプト
TradingViewの精神に則り、このスクリプトの作者はコードをオープンソースとして公開してくれました。トレーダーが内容を確認・検証できるようにという配慮です。作者に拍手を送りましょう!無料で利用できますが、コードの再公開はハウスルールに従う必要があります。
免責事項
この情報および投稿は、TradingViewが提供または推奨する金融、投資、トレード、その他のアドバイスや推奨を意図するものではなく、それらを構成するものでもありません。詳細は利用規約をご覧ください。