INVITE-ONLY SCRIPT
更新済 Megalodon Pro Automated Shorter Term Trader
How to use?
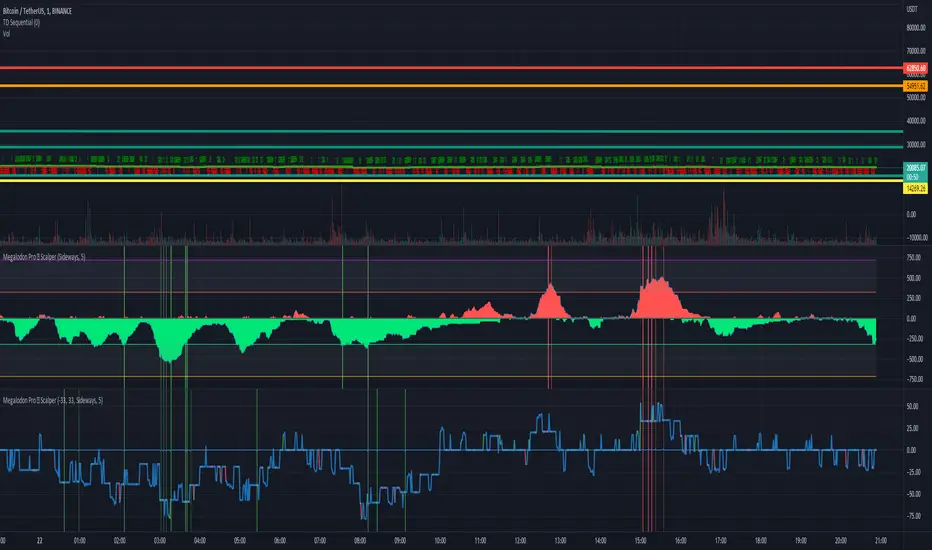
- Green cloud shows the total buy signals. Red cloud shows the total sell signals.
- Yellow line shows the difference between buy and sell signals. If yellow line is above 0, we have more SELL signals than BUY signals. If yellow line is below 0, we have more BUY signals than SELL signals.
- You should basically compare the red cloud with the green cloud to enter or exit in a trade.
- It should be used on shorter time frames. I recommend using 1 minute or 15 minute for better analysis.
- It prints Green for Buy - Orange for Strong Buy- Red for Sell - Purple for Strong Sell signals.
- This indicator basically looks for many different indicators' setups and shows you exactly what you need to know.
- You may also set alarms for 4 different signals including Buy - Strong Buy - Strong Sell - Sell
リリースノート
Panel has been updated.リリースノート
Panel issue has been fixed!リリースノート
Better calculations.リリースノート
New version of the pro trader.招待専用スクリプト
このスクリプトは作者が承認したユーザーのみアクセス可能です。使用するにはアクセス申請をして許可を得る必要があります。通常は支払い後に承認されます。詳細は下記の作者の指示に従うか、MegalodonTradingに直接お問い合わせください。
TradingViewは、作者を完全に信頼し、スクリプトの動作を理解していない限り、有料スクリプトの購入・使用を推奨しません。コミュニティスクリプトには無料のオープンソースの代替が多数あります。
作者の指示
New version of the pro.
Telegram Here t.me/bugrasukas
免責事項
この情報および投稿は、TradingViewが提供または推奨する金融、投資、トレード、その他のアドバイスや推奨を意図するものではなく、それらを構成するものでもありません。詳細は利用規約をご覧ください。
招待専用スクリプト
このスクリプトは作者が承認したユーザーのみアクセス可能です。使用するにはアクセス申請をして許可を得る必要があります。通常は支払い後に承認されます。詳細は下記の作者の指示に従うか、MegalodonTradingに直接お問い合わせください。
TradingViewは、作者を完全に信頼し、スクリプトの動作を理解していない限り、有料スクリプトの購入・使用を推奨しません。コミュニティスクリプトには無料のオープンソースの代替が多数あります。
作者の指示
New version of the pro.
Telegram Here t.me/bugrasukas
免責事項
この情報および投稿は、TradingViewが提供または推奨する金融、投資、トレード、その他のアドバイスや推奨を意図するものではなく、それらを構成するものでもありません。詳細は利用規約をご覧ください。