OPEN-SOURCE SCRIPT
更新済 SMC Structures and FVG
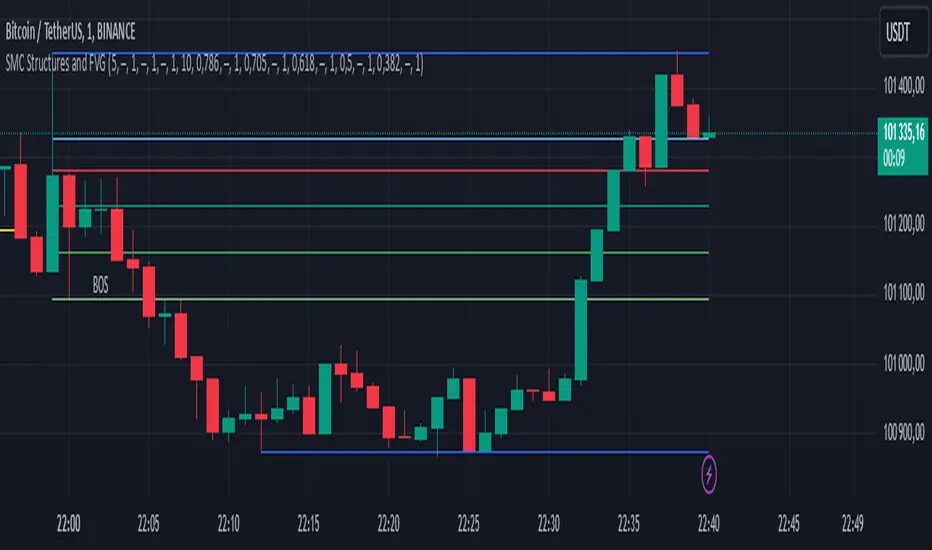
The SMC Structures and FVG indicator allows the user to easily identify trend continuations (Break Of Structure) or trend changes (CHange Of CHaracter) on any time frame. In addition, it display all FVG areas, whether they are bullish, bearish, or even mitigated.
Fair Value Gap :
The FVG process shows every bullish, bearish or even mitigated FVG liquidity area. When a FVG is fully mitigated it will directly be removed of the chart.
There is an history of FVG to show. By selecting specific number of FVG to show in the chart, the user can focus its analysis on lasts liquidity area.
Here's the rules for FVG color :
Structures analysis:
The Structure process show BOS in grey lines and CHoCH in yellow lines. It shows to the user the lasts price action pattern.
The blue lines are the high value and the low value of the current structure.
Fair Value Gap :
The FVG process shows every bullish, bearish or even mitigated FVG liquidity area. When a FVG is fully mitigated it will directly be removed of the chart.
There is an history of FVG to show. By selecting specific number of FVG to show in the chart, the user can focus its analysis on lasts liquidity area.
Here's the rules for FVG color :
- Green when it's a bullish FVG and has not been mitigated
- Red when it's a bearish FVG and has not been mitigated
- Gray when the bullish / bearish FVG has been mitigated
- Removed when the FVG has been fully mitigated
Structures analysis:
The Structure process show BOS in grey lines and CHoCH in yellow lines. It shows to the user the lasts price action pattern.
The blue lines are the high value and the low value of the current structure.
リリースノート
Adding the "Reduce mitigated FVG" parameterUser can check this parameter to reduce mitigated FVG area. This will show exactly where is FVG that has not been mitigated on the chart.
The mitigated FVG color is still grey.
This new parameter is disabled by default but can be enabled at any time
リリースノート
Adding alerts when FVG is mitigatedWith this new feature, user can add an alert directly from the indicator. It will be sent when a FVG area has been mitigated.
リリースノート
Set bullish and bearish BOS/CHoCH colorWith this new feature, user can now change BOS and CHoCH color compared to its direction (bullish or bearish).
With this new version, there can now be up to 4 different colors during a structure change.
リリースノート
Adding Fibonacci retracement levels of the current structureIn this new version, the user can display up to 5 Fibonacci retracement levels that will be applied to the current structure.
The user can also modify the value, color, style, and thickness of the line associated to each retracement.
The default values are as follows: 0.786, 0.705, 0.618, 0.5, and 0.382.
リリースノート
Fix fibonacci line style parameterリリースノート
Addition of Alerts During a BOS / CHOCH.To add this feature, you will need to use the "Create an Alert" tool and select the condition "SMC Structures and FVG."
Two alerts are currently available for BOS / CHOCH (do not select "Any alert() function call").
オープンソーススクリプト
TradingViewの精神に則り、このスクリプトの作者はコードをオープンソースとして公開してくれました。トレーダーが内容を確認・検証できるようにという配慮です。作者に拍手を送りましょう!無料で利用できますが、コードの再公開はハウスルールに従う必要があります。
免責事項
この情報および投稿は、TradingViewが提供または推奨する金融、投資、トレード、その他のアドバイスや推奨を意図するものではなく、それらを構成するものでもありません。詳細は利用規約をご覧ください。
オープンソーススクリプト
TradingViewの精神に則り、このスクリプトの作者はコードをオープンソースとして公開してくれました。トレーダーが内容を確認・検証できるようにという配慮です。作者に拍手を送りましょう!無料で利用できますが、コードの再公開はハウスルールに従う必要があります。
免責事項
この情報および投稿は、TradingViewが提供または推奨する金融、投資、トレード、その他のアドバイスや推奨を意図するものではなく、それらを構成するものでもありません。詳細は利用規約をご覧ください。