OPEN-SOURCE SCRIPT
Volume Chart
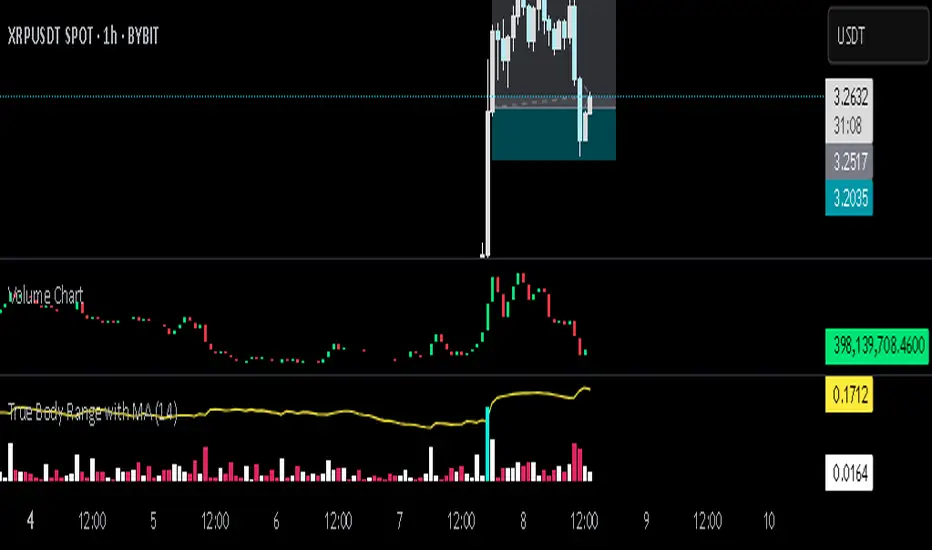
This Pine Script indicator, written in TradingView’s version 6, visualizes trading volume as a custom candlestick chart instead of a standard histogram. Rather than plotting volume bars, it constructs synthetic candles where each candle’s "open" is set to the previous candle’s "close" (stored in prevClose). The "close" of the synthetic candle moves upward by the volume value if the actual price candle was bullish (close > open) and downward by the volume value if it was bearish, with the "high" and "low" both fixed to the open to create a flat candle body line. This transforms volume into a price-like cumulative visual flow, color-coded green for bullish and red for bearish periods, allowing traders to intuitively track whether volume pressure is accumulating upward or downward over time, as though volume itself were moving like a market price series.
オープンソーススクリプト
TradingViewの精神に則り、このスクリプトの作者はコードをオープンソースとして公開してくれました。トレーダーが内容を確認・検証できるようにという配慮です。作者に拍手を送りましょう!無料で利用できますが、コードの再公開はハウスルールに従う必要があります。
免責事項
この情報および投稿は、TradingViewが提供または推奨する金融、投資、トレード、その他のアドバイスや推奨を意図するものではなく、それらを構成するものでもありません。詳細は利用規約をご覧ください。
オープンソーススクリプト
TradingViewの精神に則り、このスクリプトの作者はコードをオープンソースとして公開してくれました。トレーダーが内容を確認・検証できるようにという配慮です。作者に拍手を送りましょう!無料で利用できますが、コードの再公開はハウスルールに従う必要があります。
免責事項
この情報および投稿は、TradingViewが提供または推奨する金融、投資、トレード、その他のアドバイスや推奨を意図するものではなく、それらを構成するものでもありません。詳細は利用規約をご覧ください。