OPEN-SOURCE SCRIPT
更新済 Bull Market Support Band (20w SMA, 21w EMA)
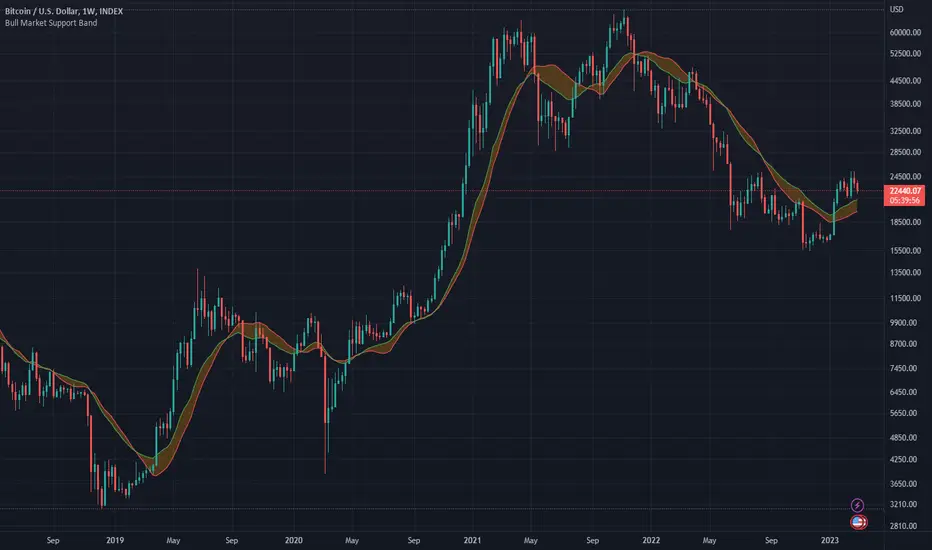
This moving average indicator is a bull market support band. It's significance comes from the previous bull runs where the price was bouncing off or riding from a distance the support band until the end of the market cycle. For example, during the 2017 bull run, Bitcoin had several 30-40% corrections to the support band.
The green line represents the 20 weeks simple moving average and the red line represents the 21 weeks exponential moving average. The best way to read the current value is to look at the weekly chart, but any time frame will display the same values.
The green line represents the 20 weeks simple moving average and the red line represents the 21 weeks exponential moving average. The best way to read the current value is to look at the weekly chart, but any time frame will display the same values.
リリースノート
Smooth lines on non-weekly timeframes.リリースノート
Removed deprecated "color" attribute in "fill" function and changed "color" attribute accordingly.リリースノート
Fixed a bug where changing the indicator timeframe does not change the lengths of the moving averages. リリースノート
Bumped the version to v5.リリースノート
Fixed a bug where there is a gap between the latest indicator data and the chart's latest data on timeframes lower than weekly.リリースノート
Reverted last big fix since it is removed multi timeframe functionality.リリースノート
Same as aboveオープンソーススクリプト
TradingViewの精神に則り、この作者はスクリプトのソースコードを公開しているので、その内容を理解し検証することができます。作者に感謝です!無料でお使いいただけますが、このコードを投稿に再利用する際にはハウスルールに従うものとします。
免責事項
これらの情報および投稿は、TradingViewが提供または保証する金融、投資、取引、またはその他の種類のアドバイスや推奨を意図したものではなく、またそのようなものでもありません。詳しくは利用規約をご覧ください。
オープンソーススクリプト
TradingViewの精神に則り、この作者はスクリプトのソースコードを公開しているので、その内容を理解し検証することができます。作者に感謝です!無料でお使いいただけますが、このコードを投稿に再利用する際にはハウスルールに従うものとします。
免責事項
これらの情報および投稿は、TradingViewが提供または保証する金融、投資、取引、またはその他の種類のアドバイスや推奨を意図したものではなく、またそのようなものでもありません。詳しくは利用規約をご覧ください。