OPEN-SOURCE SCRIPT
更新済 Anchored Progressive Range

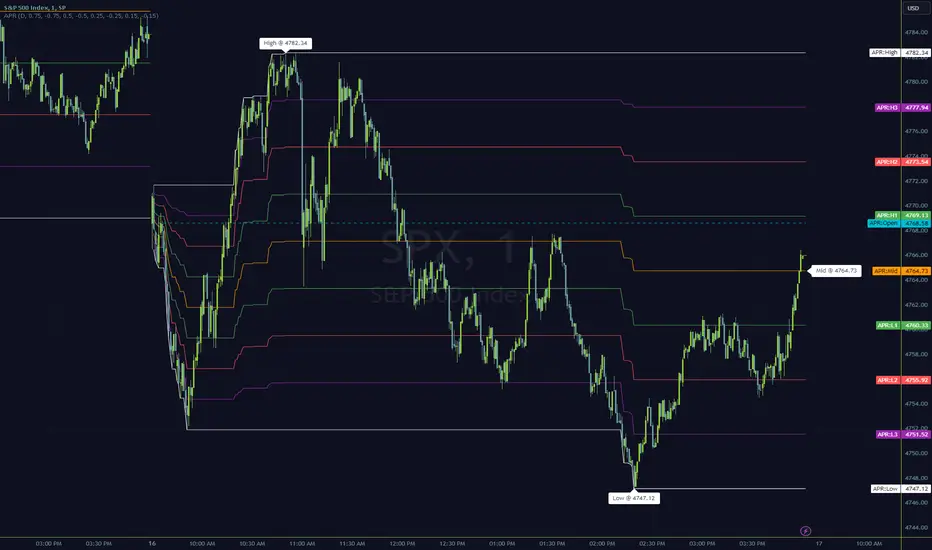
Introducing a simple script based off of the idea that ranges form from a point of origin that can be measured and produce interesting analysis indicating potential opportunities.
Specifically I use this on daily and weekly anchorage to find mid range retracements once range has developed.
Configure internal multipliers to provide potentially useful measurements between range high and mid point, as well as mid point and range low. By default it's standard .25 based multipliers but one could adjust to fib multipliers such as .615, .65, etc.
Anchored open price is plotted as continuous line as often times reversals will occur and open price will be tested on daily, weekly, monthly timeframes.
Once a bit of range is established and there's a rapid adjustment of range mid up or down, these can signal interesting breakouts. Also areas where the range stays flat due to no new high or low being printed can be indicative of consolidation, etc.
I've tested this with heikin ashi, renko, bars, line and regular candles through various markets such as futures, etfs and stocks and everything appears to anchor correctly, please feedback if experiencing otherwise.
I hope you enjoy this indicator as much as I enjoyed creating it, happy trading!
リリースノート
Updated anchor input to timeframe input and opened it up to whatever you want, I'm honestly not sure what I was thinking restricting it to only a subset :DEnjoy!
オープンソーススクリプト
TradingViewの精神に則り、このスクリプトの作者はコードをオープンソースとして公開してくれました。トレーダーが内容を確認・検証できるようにという配慮です。作者に拍手を送りましょう!無料で利用できますが、コードの再公開はハウスルールに従う必要があります。
@tradeseekers (YouTube, Twitter)
免責事項
この情報および投稿は、TradingViewが提供または推奨する金融、投資、トレード、その他のアドバイスや推奨を意図するものではなく、それらを構成するものでもありません。詳細は利用規約をご覧ください。
オープンソーススクリプト
TradingViewの精神に則り、このスクリプトの作者はコードをオープンソースとして公開してくれました。トレーダーが内容を確認・検証できるようにという配慮です。作者に拍手を送りましょう!無料で利用できますが、コードの再公開はハウスルールに従う必要があります。
@tradeseekers (YouTube, Twitter)
免責事項
この情報および投稿は、TradingViewが提供または推奨する金融、投資、トレード、その他のアドバイスや推奨を意図するものではなく、それらを構成するものでもありません。詳細は利用規約をご覧ください。