OPEN-SOURCE SCRIPT
更新済 RSI Scalping Gold (XAUUSD) - v5
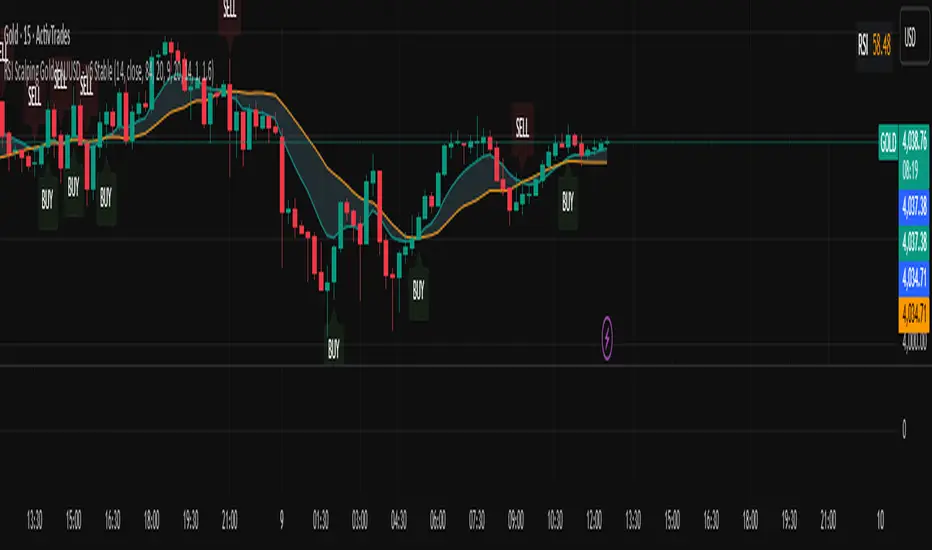
Displays the EMA9 and SMA20 to identify the trend.
Colors the area between the two averages to better visualize the equilibrium zone.
Displays green (buy) and red (sell) arrows aligned with the candles.
The RSI is calculated but hidden from the main chart (you can activate it by checking “Display on chart” in the settings).
Colors the area between the two averages to better visualize the equilibrium zone.
Displays green (buy) and red (sell) arrows aligned with the candles.
The RSI is calculated but hidden from the main chart (you can activate it by checking “Display on chart” in the settings).
リリースノート
What this version adds:Visible and offset arrows and labels → clearer across all timeframes.
SL/TP directly on the label for each signal.
EMA9/SMA20 zone with transparent sky blue background.
Automatic BUY/SELL alerts as soon as the signal appears.
RSI chart updated in real time.
オープンソーススクリプト
TradingViewの精神に則り、この作者はスクリプトのソースコードを公開しているので、その内容を理解し検証することができます。作者に感謝です!無料でお使いいただけますが、このコードを投稿に再利用する際にはハウスルールに従うものとします。
免責事項
これらの情報および投稿は、TradingViewが提供または保証する金融、投資、取引、またはその他の種類のアドバイスや推奨を意図したものではなく、またそのようなものでもありません。詳しくは利用規約をご覧ください。
オープンソーススクリプト
TradingViewの精神に則り、この作者はスクリプトのソースコードを公開しているので、その内容を理解し検証することができます。作者に感謝です!無料でお使いいただけますが、このコードを投稿に再利用する際にはハウスルールに従うものとします。
免責事項
これらの情報および投稿は、TradingViewが提供または保証する金融、投資、取引、またはその他の種類のアドバイスや推奨を意図したものではなく、またそのようなものでもありません。詳しくは利用規約をご覧ください。