OPEN-SOURCE SCRIPT
更新済 Ultimate Volume
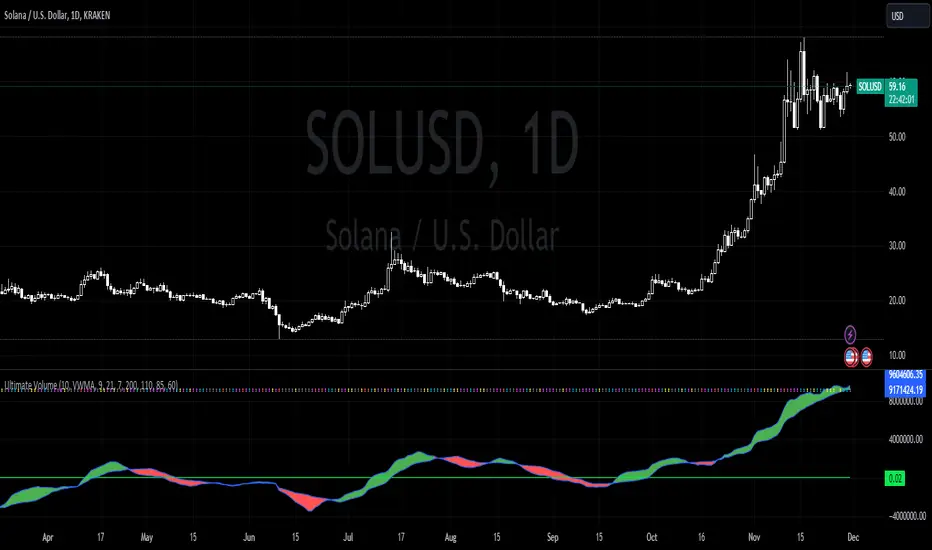
The Ultimate Volume indicator combines three volume calculations and plots each signal in a single indicator. Behold!
Relative Volume
an indicator that tells traders how current volume is compared to past trading volumes over a given period. It is kind of like a radar for how “in-play” a stock is. The higher the relative volume is, the more in play it is. Relative Volume is displayed as a ratio. So if it is showing 3.5 relative volume, that means it is trading at 3.5 times its normal volume.
Plotted as a green number on the chart
Trend Volume
An extension to "On Balance Volume Momentum (OBV Momentum)".
"OBV Trend" is a trend strength indicator, that can be used to identify strong trends and also trend changes based on volume.
High positive values indicate strong volume on the buy side, high negative values indicate strong volume on the sell side.
An increasing OBV trend indicates a strengthening buy trend or a weakening sell trend,
decreasing OBV trend indicates a strengthening sell trend or weakening buy trend.
OBV trend is calculated by plotting a short vs. a long moving average and filling the difference in volume.
Volume Arrows
As a general rule, when a stock goes up on low volume, it's seen as negative because it means buyers aren't committed. When a stock goes down on low volume, it means that not many people are trying to sell it, which is positive. The indicator calculates the average volume for the user selected lookback period. From there a ratio of the current volume vs the average volume is used to determine the candle’s colors.
Plots as colored arrows.
Red = Extreme Demand
Pink = High Demand
Aqua = Average Demand
Yellow = Light Demand
Grey = Dry Demand
リリースノート
.リリースノート
..オープンソーススクリプト
TradingViewの精神に則り、このスクリプトの作者はコードをオープンソースとして公開してくれました。トレーダーが内容を確認・検証できるようにという配慮です。作者に拍手を送りましょう!無料で利用できますが、コードの再公開はハウスルールに従う必要があります。
免責事項
この情報および投稿は、TradingViewが提供または推奨する金融、投資、トレード、その他のアドバイスや推奨を意図するものではなく、それらを構成するものでもありません。詳細は利用規約をご覧ください。
オープンソーススクリプト
TradingViewの精神に則り、このスクリプトの作者はコードをオープンソースとして公開してくれました。トレーダーが内容を確認・検証できるようにという配慮です。作者に拍手を送りましょう!無料で利用できますが、コードの再公開はハウスルールに従う必要があります。
免責事項
この情報および投稿は、TradingViewが提供または推奨する金融、投資、トレード、その他のアドバイスや推奨を意図するものではなく、それらを構成するものでもありません。詳細は利用規約をご覧ください。