OPEN-SOURCE SCRIPT
Table: Colorable Timeframes Top-Down Analysis
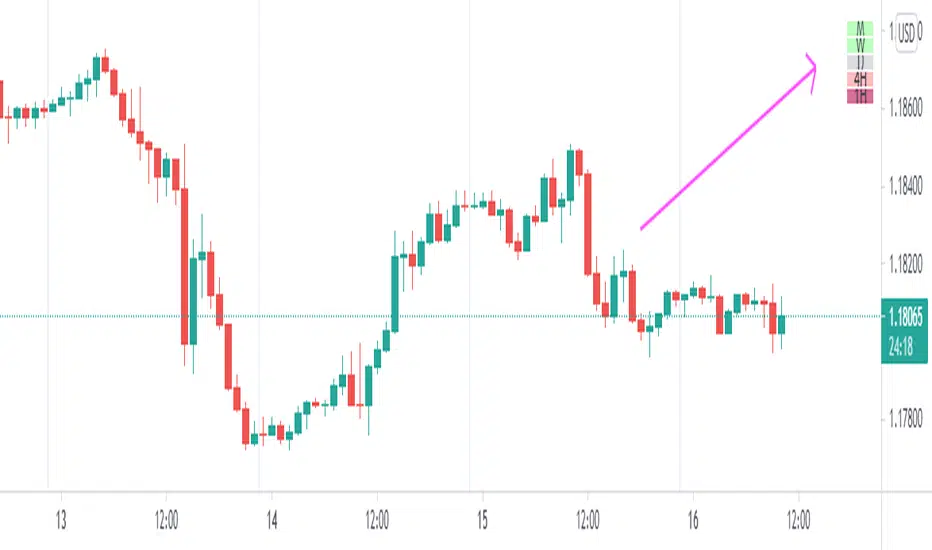
This is a very simple indicator that lets you color up to five different cells. After doing Top-Down analysis, you are probably going to stay on the lowest of timeframes, and if you work with many tickers, you may forget the bigger picture or confuse them.
So you can make some timeframes green if they are bullish or red if they are bearish and you will always have a reminder on the screen in the form of this small non-intrusive table.
So you can make some timeframes green if they are bullish or red if they are bearish and you will always have a reminder on the screen in the form of this small non-intrusive table.
オープンソーススクリプト
TradingViewの精神に則り、このスクリプトの作者はコードをオープンソースとして公開してくれました。トレーダーが内容を確認・検証できるようにという配慮です。作者に拍手を送りましょう!無料で利用できますが、コードの再公開はハウスルールに従う必要があります。
免責事項
この情報および投稿は、TradingViewが提供または推奨する金融、投資、トレード、その他のアドバイスや推奨を意図するものではなく、それらを構成するものでもありません。詳細は利用規約をご覧ください。
オープンソーススクリプト
TradingViewの精神に則り、このスクリプトの作者はコードをオープンソースとして公開してくれました。トレーダーが内容を確認・検証できるようにという配慮です。作者に拍手を送りましょう!無料で利用できますが、コードの再公開はハウスルールに従う必要があります。
免責事項
この情報および投稿は、TradingViewが提供または推奨する金融、投資、トレード、その他のアドバイスや推奨を意図するものではなく、それらを構成するものでもありません。詳細は利用規約をご覧ください。