OPEN-SOURCE SCRIPT
更新済 TICK Extreme Zones Indicator Overlay
Overview:
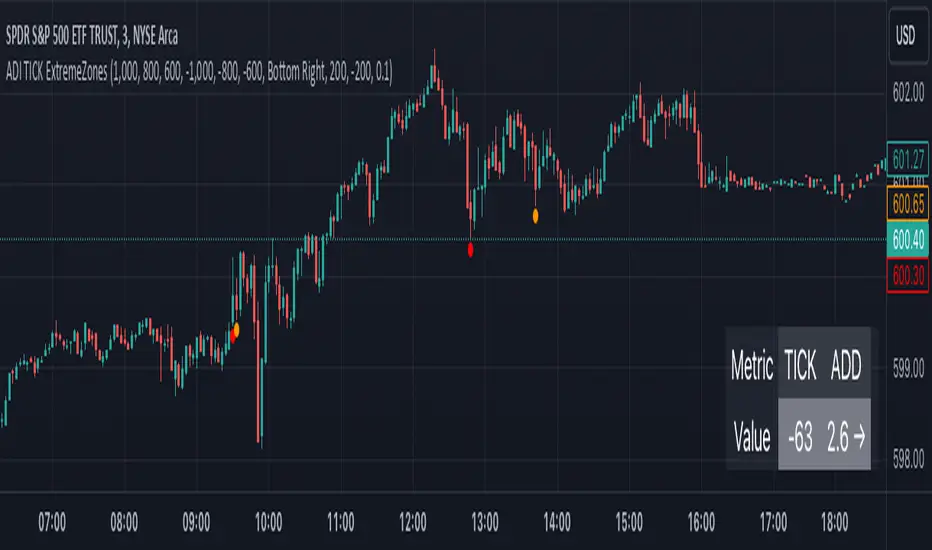
The TICK Extreme Zones Indicator Overlay is designed to gauge the overall market trend using the TICK index. By determining the number of bullish (values above 0) and bearish (values below 0) TICK closes within a user-specified lookback period, it provides an insight into the prevailing market sentiment. This insight can be beneficial for traders looking to identify potential entry or exit points based on the market's strength or weakness.
Key Features:
Lookback Period: This is a user-defined time frame in minutes. The indicator counts the number of bullish and bearish TICK closes within this period.
Market Trend Label: Based on the TICK values, the indicator determines if the market is:
Uptrending: Majority of TICK values are positive.
Downtrending: Majority are negative.
Neutral/Rangebound: Equal positive and negative closes.
Zones: These represent certain threshold levels in the TICK values.
Positive Zones:
Dark Blue: 1000
Light Blue: 800 & 600
Negative Zones:
Red: -1000
Yellow: -800 & -600
Touch Detection Method: Detects intraday touches and can be toggled on/off based on the user's preference.
Usage Guidelines:
Trending Market:
In a trending market, the TICK index can remain consistently above or below zero.
For a market moving upwards, it's advisable to consider entering a trade when the indicator returns to zero instead of waiting for it to return to -1000.
Using Exponential Moving Averages (EMAs) can provide additional confirmation of the trend.
Rangebound Market:
For sideways markets, consider initiating a long position when the TICK index goes below -1000 and exit the position when the index reaches +1000.
It's beneficial to pair these readings with significant support and resistance levels to make more informed trading decisions.
Divergence:
Divergence between the TICK index and price can be a good measure of the underlying market strength.
If a stock's price is making lower lows, but the TICK index is making higher lows, it might indicate weakening selling momentum.
Notes:
- Always use this indicator in conjunction with other technical analysis tools.
- Proper risk management practices are crucial when using any trading tool or strategy.
リリースノート
- Added a toggle to move the label from 'Top Right' to 'Bottom Right'リリースノート
- Added title/info to the plots in settings.リリースノート
Fixed an issue with plotting and commented out the plots for (-+)600 and 800 values. You can comment them back in if you prefer. リリースノート
V1.2リリースノート
Redefined the Market label by removing the Market Trend function due to this being noisy and added two other Market Internals instead (ADD and VOLSPD) which can be used in conjunction with TICK.リリースノート
- Updated Chart.リリースノート
- Added Toggling for Labelsリリースノート
// V2.2 - Replaced lookback inputs for ADD and VOLSPD with 3-minute Simple Moving Averages (SMA) for trend determination.// - Simplified code structure and ensured compatibility with Quiet Zones.
// - Added customizability for each zone, allowing users to adjust thresholds and visibility.
//
// Market Trend Determination via
// - Utilizes a 3-minute Simple Moving Average (SMA) for smoother trend determination (ADD & VOLD).
// - Analyzes trends in TICK, ADD, and VOLSPD values for increased decision-making accuracy.
// - Displays the trend as a label on the chart with color-coded indicators (Green: Increasing, Red: Decreasing).
リリースノート
- fixed typos.オープンソーススクリプト
TradingViewの精神に則り、このスクリプトの作者はコードをオープンソースとして公開してくれました。トレーダーが内容を確認・検証できるようにという配慮です。作者に拍手を送りましょう!無料で利用できますが、コードの再公開はハウスルールに従う必要があります。
免責事項
この情報および投稿は、TradingViewが提供または推奨する金融、投資、トレード、その他のアドバイスや推奨を意図するものではなく、それらを構成するものでもありません。詳細は利用規約をご覧ください。
オープンソーススクリプト
TradingViewの精神に則り、このスクリプトの作者はコードをオープンソースとして公開してくれました。トレーダーが内容を確認・検証できるようにという配慮です。作者に拍手を送りましょう!無料で利用できますが、コードの再公開はハウスルールに従う必要があります。
免責事項
この情報および投稿は、TradingViewが提供または推奨する金融、投資、トレード、その他のアドバイスや推奨を意図するものではなく、それらを構成するものでもありません。詳細は利用規約をご覧ください。