OPEN-SOURCE SCRIPT
Price Channel Marker
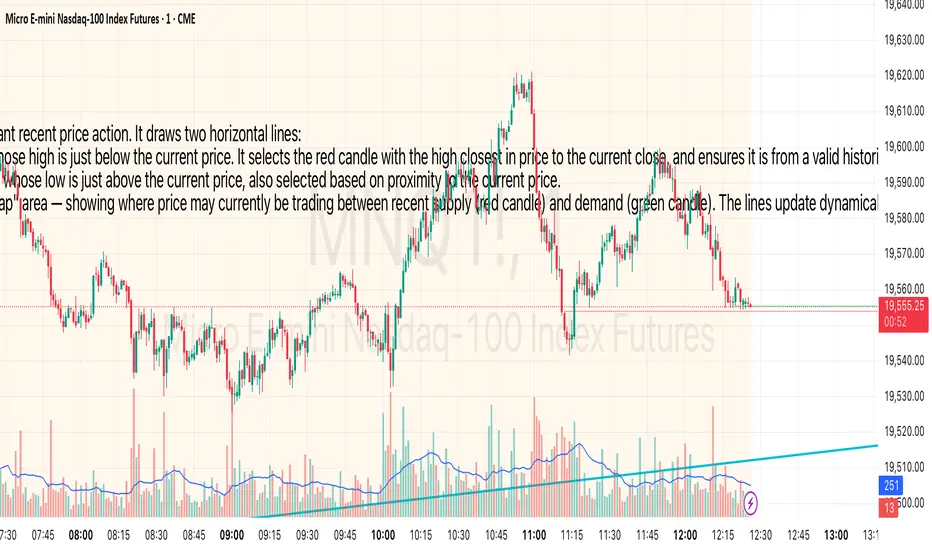
This indicator identifies a dynamic price channel based on the most relevant recent price action. It draws two horizontal lines:
* 🔴 Red Line – Marks the high of the most recent red candle (bearish) whose high is just below the current price. It selects the red candle with the high closest in price to the current close, and ensures it is from a valid historical context (ignoring recent highs above the current price).
* 🟢 Green Line – Marks the low of the most recent green candle (bullish) whose low is just above the current price, also selected based on proximity to the current price.
Together, these two lines define a potential price compression zone or "trap" area — showing where price may currently be trading between recent supply (red candle) and demand (green candle). The lines update dynamically and extend into the future to help visualize breakout or rejection levels.
Use Cases:
* Spot potential breakout zones.
* Define short-term support and resistance.
* Filter for entries in range-bound or squeeze conditions.
Customization:
* Adjustable lookback range (up to 5000 bars).
* Colors and line style are easily customizable.
オープンソーススクリプト
TradingViewの精神に則り、このスクリプトの作者はコードをオープンソースとして公開してくれました。トレーダーが内容を確認・検証できるようにという配慮です。作者に拍手を送りましょう!無料で利用できますが、コードの再公開はハウスルールに従う必要があります。
免責事項
この情報および投稿は、TradingViewが提供または推奨する金融、投資、トレード、その他のアドバイスや推奨を意図するものではなく、それらを構成するものでもありません。詳細は利用規約をご覧ください。
オープンソーススクリプト
TradingViewの精神に則り、このスクリプトの作者はコードをオープンソースとして公開してくれました。トレーダーが内容を確認・検証できるようにという配慮です。作者に拍手を送りましょう!無料で利用できますが、コードの再公開はハウスルールに従う必要があります。
免責事項
この情報および投稿は、TradingViewが提供または推奨する金融、投資、トレード、その他のアドバイスや推奨を意図するものではなく、それらを構成するものでもありません。詳細は利用規約をご覧ください。