OPEN-SOURCE SCRIPT
Trade 1 + Statergy
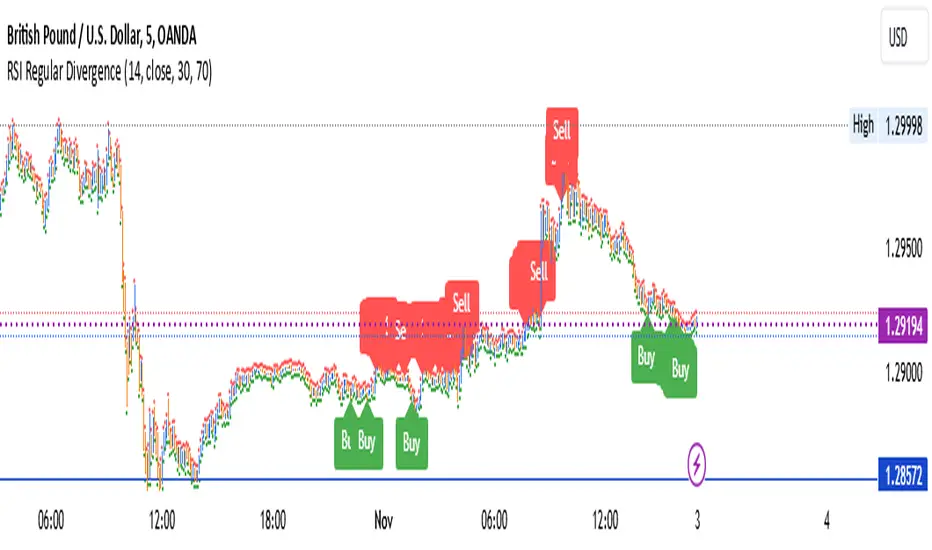
The Relative Strength Index (RSI) is a momentum oscillator used in technical analysis that measures the speed and change of price movements of a security within a range of 0 to 100. It is most commonly set to a 14-period timeframe and helps traders identify overbought or oversold conditions, suggesting potential reversal points in the market. Divergence occurs when the price trend and the RSI trend move in opposite directions. A bullish divergence signals potential upward movement when prices are making new lows while the RSI makes higher lows. Conversely, a bearish divergence suggests a possible downward trend when prices are making new highs but the RSI is making lower highs. These signals are crucial for traders looking to capture shifts in momentum and adjust their trading strategies accordingly.
use full to
5 min
10 min
15 min decition
use full to
5 min
10 min
15 min decition
オープンソーススクリプト
TradingViewの精神に則り、このスクリプトの作者はコードをオープンソースとして公開してくれました。トレーダーが内容を確認・検証できるようにという配慮です。作者に拍手を送りましょう!無料で利用できますが、コードの再公開はハウスルールに従う必要があります。
免責事項
この情報および投稿は、TradingViewが提供または推奨する金融、投資、トレード、その他のアドバイスや推奨を意図するものではなく、それらを構成するものでもありません。詳細は利用規約をご覧ください。
オープンソーススクリプト
TradingViewの精神に則り、このスクリプトの作者はコードをオープンソースとして公開してくれました。トレーダーが内容を確認・検証できるようにという配慮です。作者に拍手を送りましょう!無料で利用できますが、コードの再公開はハウスルールに従う必要があります。
免責事項
この情報および投稿は、TradingViewが提供または推奨する金融、投資、トレード、その他のアドバイスや推奨を意図するものではなく、それらを構成するものでもありません。詳細は利用規約をご覧ください。