OPEN-SOURCE SCRIPT
Camarilla screener
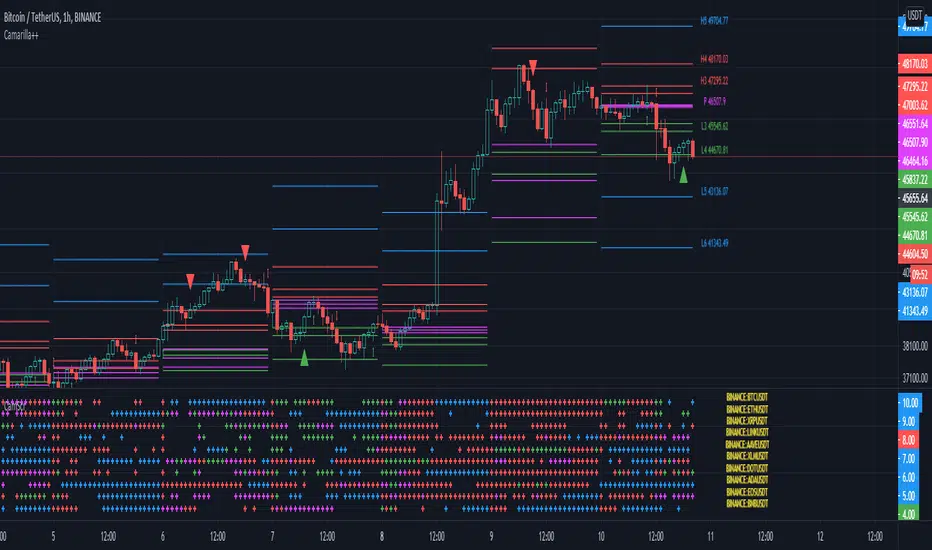
Basic script to screen up to 10 tickers with regards to their central pivot range and camarilla pivots.
Same color layout as the Danarilla script (tradingview.com/script/6CW0Ltac-VPTbollfib-Camarilla-Danarilla/).
The colors in the screener mean the following:
Resolution can be changed for the calculation of the pivots.
Script contains snippets from other screeners and the Danarilla script so many thanks to all who publish their scripts.
Same color layout as the Danarilla script (tradingview.com/script/6CW0Ltac-VPTbollfib-Camarilla-Danarilla/).
The colors in the screener mean the following:
- Blue : bar close price is > H4 or < L4
- Red : bar close price is < H3 and > CPR top
- Fuchsia : bar close price is < CPR top and > CPR bottom
- Green : bar close price is < CPR bottom and > L3
- No color means it is between H4/H3 or L3/L4
Resolution can be changed for the calculation of the pivots.
Script contains snippets from other screeners and the Danarilla script so many thanks to all who publish their scripts.
オープンソーススクリプト
TradingViewの精神に則り、このスクリプトの作者はコードをオープンソースとして公開してくれました。トレーダーが内容を確認・検証できるようにという配慮です。作者に拍手を送りましょう!無料で利用できますが、コードの再公開はハウスルールに従う必要があります。
免責事項
この情報および投稿は、TradingViewが提供または推奨する金融、投資、トレード、その他のアドバイスや推奨を意図するものではなく、それらを構成するものでもありません。詳細は利用規約をご覧ください。
オープンソーススクリプト
TradingViewの精神に則り、このスクリプトの作者はコードをオープンソースとして公開してくれました。トレーダーが内容を確認・検証できるようにという配慮です。作者に拍手を送りましょう!無料で利用できますが、コードの再公開はハウスルールに従う必要があります。
免責事項
この情報および投稿は、TradingViewが提供または推奨する金融、投資、トレード、その他のアドバイスや推奨を意図するものではなく、それらを構成するものでもありません。詳細は利用規約をご覧ください。