OPEN-SOURCE SCRIPT
更新済 Logarithmic Bollinger Bands [MisterMoTA]

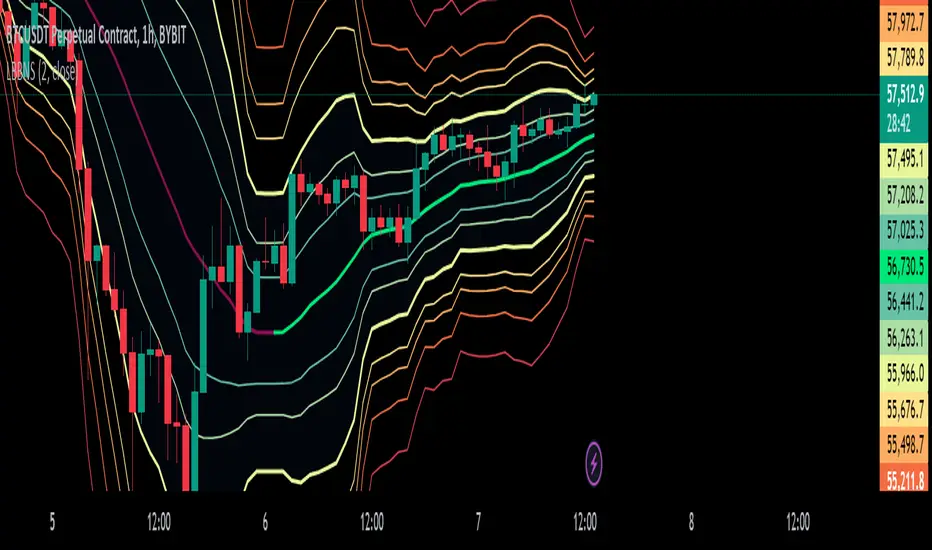
The script plot the normal top and bottom Bollinger Bands and from them and SMA 20 it finds fibonacci logarithmic levels where price can find temporary support/resistance.
To get the best results need to change the standard deviation to your simbol value, like current for BTC the Standards Deviation is 2.61, current Standard Deviation for ETH is 2.55.. etc.. find the right current standard deviation of your simbol with a search online.
The lines ploted by indicators are:
Let me know If you find the indicator useful or PM if you need any custom changes to it.
To get the best results need to change the standard deviation to your simbol value, like current for BTC the Standards Deviation is 2.61, current Standard Deviation for ETH is 2.55.. etc.. find the right current standard deviation of your simbol with a search online.
The lines ploted by indicators are:
- Main line is a 20 SMA
- 2 retracement Logarithmic Fibonacci 0.382 levels above and bellow 20 sma
- 2 retracement Logarithmic Fibonacci 0.618 levels above and bellow 20 sma
- Top and Bottom Bollindger bands (ticker than the rest of the lines)
- 2 expansion Logarithmic Fibonacci 0.382 levels above Top BB and bellow Bottom BB
- 2 expansion Logarithmic Fibonacci 0.618 levels above Top BB and bellow Bottom BB
- 2 expansion Logarithmic Fibonacci level 1 above Top BB and bellow Bottom BB
- 2 expansion Logarithmic Fibonacci 1.618 levels above Top BB and bellow Bottom BB
Let me know If you find the indicator useful or PM if you need any custom changes to it.
リリースノート
- removed decimals and labels as Tradingview does a good job on displaying the labels on scales
- option to hide values on scales
- added color coded trend for 20 sma that can be disabled from dashboard
オープンソーススクリプト
TradingViewの精神に則り、このスクリプトの作者はコードをオープンソースとして公開してくれました。トレーダーが内容を確認・検証できるようにという配慮です。作者に拍手を送りましょう!無料で利用できますが、コードの再公開はハウスルールに従う必要があります。
免責事項
この情報および投稿は、TradingViewが提供または推奨する金融、投資、トレード、その他のアドバイスや推奨を意図するものではなく、それらを構成するものでもありません。詳細は利用規約をご覧ください。
オープンソーススクリプト
TradingViewの精神に則り、このスクリプトの作者はコードをオープンソースとして公開してくれました。トレーダーが内容を確認・検証できるようにという配慮です。作者に拍手を送りましょう!無料で利用できますが、コードの再公開はハウスルールに従う必要があります。
免責事項
この情報および投稿は、TradingViewが提供または推奨する金融、投資、トレード、その他のアドバイスや推奨を意図するものではなく、それらを構成するものでもありません。詳細は利用規約をご覧ください。