INVITE-ONLY SCRIPT
更新済 NIBIRU MATRIX
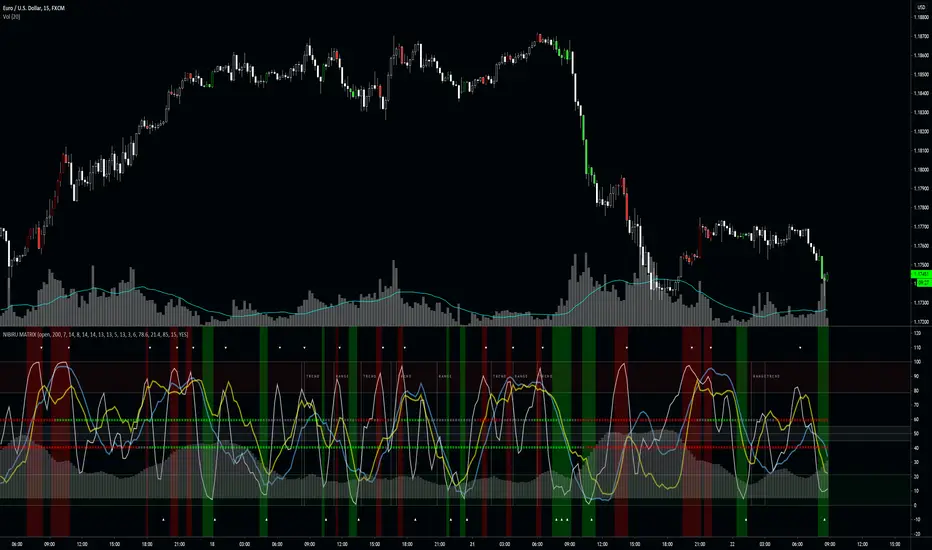
The Nibiru Matrix is an entry timing tool based on oscillators and trends. It's to provide an intuitive way of timing trades when price is at the resistance or on the support.
The Nibiru Matrix provides trade entry hints and information about the current market behavior (trending or ranging). If the market is trending, it also shows the trend strength and direction. It is a secondary indicator meaning it trade should be made on the support or resistance using Nibiru Matrix as a confluence indicator.
What it plots?
Indicator components:

Trend/range setup - provides information about current possible trade strategy. Following a RANGE indicator, Voodoo Matrix suggests that the safest way to trade will be between the local support and resistance shown by Voodoo Support and Resistance, and following a TREND indicator, it is likely that a trending strategy or taking profit on larger ranges is more profitable.
Fast trend indicator - providing color based information on direction of the short-term trend. This is the most reactive trend indication shown by Voodoo Matrix. This can even be used for counter-main-trend scalping.
Slow trend indicator - providing color based information on direction of the long-term trend. It is based on the behavior of a longer period EMAs.
Volatility histogram - information on current price strength. Best used in confluence with the short term trend indicator.
Fast oscillator - oscillator based on stochastic RSI, modified to provide better information on timing and price movement. It's fast moving which helps time the shorter-term moves.
Slow oscillator - oscillator based on stochastic RSI, modified to provide better information on timing and price movement. It's slow moving and provides useful information about the price direction and strength of the move.
Stochastic oscillator - simple stochastic oscillator. Best used with both Fast and Slow Oscillators to get best timing and price movement strength and direction.
Overbought zone - area of the chart where the modified stochastic oscillator suggests the market is currently overbought.
Oversold zone - area of the chart where the modified stochastic oscillator suggests the market is currently oversold.
Neutral zone - area of the chart where the modified stochastic oscillator suggests the market is currently neutral.
Timing confirmation hints - signaling confirmation of fast oscillator forming a buy/sell setup.
Fast oscillator buy/sell color hints – bar coloring to bring a focus and attention to possible buy/sell signal forming on the fast oscillator.
Use the link below or PM me to gain access to the indicator.
The Nibiru Matrix provides trade entry hints and information about the current market behavior (trending or ranging). If the market is trending, it also shows the trend strength and direction. It is a secondary indicator meaning it trade should be made on the support or resistance using Nibiru Matrix as a confluence indicator.
What it plots?
- Slow, fast and stochastic oscillators
- Bar coloring to warn about possible setups
- Trending/ranging market indication
- Current volatility
- 2 methods of trend confirmation based on 2 different algorithms
Indicator components:
Trend/range setup - provides information about current possible trade strategy. Following a RANGE indicator, Voodoo Matrix suggests that the safest way to trade will be between the local support and resistance shown by Voodoo Support and Resistance, and following a TREND indicator, it is likely that a trending strategy or taking profit on larger ranges is more profitable.
Fast trend indicator - providing color based information on direction of the short-term trend. This is the most reactive trend indication shown by Voodoo Matrix. This can even be used for counter-main-trend scalping.
- Green - uptrend
- Red - downtrend
- Gray - indecision
Slow trend indicator - providing color based information on direction of the long-term trend. It is based on the behavior of a longer period EMAs.
- Green - uptrend
- Red - downtrend
- Gray - indecision
Volatility histogram - information on current price strength. Best used in confluence with the short term trend indicator.
Fast oscillator - oscillator based on stochastic RSI, modified to provide better information on timing and price movement. It's fast moving which helps time the shorter-term moves.
Slow oscillator - oscillator based on stochastic RSI, modified to provide better information on timing and price movement. It's slow moving and provides useful information about the price direction and strength of the move.
Stochastic oscillator - simple stochastic oscillator. Best used with both Fast and Slow Oscillators to get best timing and price movement strength and direction.
Overbought zone - area of the chart where the modified stochastic oscillator suggests the market is currently overbought.
Oversold zone - area of the chart where the modified stochastic oscillator suggests the market is currently oversold.
Neutral zone - area of the chart where the modified stochastic oscillator suggests the market is currently neutral.
Timing confirmation hints - signaling confirmation of fast oscillator forming a buy/sell setup.
Fast oscillator buy/sell color hints – bar coloring to bring a focus and attention to possible buy/sell signal forming on the fast oscillator.
Use the link below or PM me to gain access to the indicator.
リリースノート
have modified the algorithm and inputs used to generate this indicator.リリースノート
Changes:- visual overview of the indicator
- replaced one oscillator with 3 different ones: Slow, Fast and Stochastic
- added new inputs for better tweaking options
リリースノート
Changed colors and fine - tuned the overall performanceリリースノート
- Changes in indicators colors
- Added Scalp mode - visual help to time entries/exits
- Added buy/sell zone
- Added background coloring when fast oscillator enters Buy/Sell zone
- Removed crossover hints
- Added timing confirmation hints
- Minor indicator calculation tweaks
リリースノート
Technical update.招待専用スクリプト
このスクリプトは作者が承認したユーザーのみアクセス可能です。使用するにはアクセス申請をして許可を得る必要があります。通常は支払い後に承認されます。詳細は下記の作者の指示に従うか、CJackiedaBearに直接お問い合わせください。
TradingViewは、作者を完全に信頼し、スクリプトの動作を理解していない限り、有料スクリプトの購入・使用を推奨しません。コミュニティスクリプトには無料のオープンソースの代替が多数あります。
作者の指示
免責事項
この情報および投稿は、TradingViewが提供または推奨する金融、投資、トレード、その他のアドバイスや推奨を意図するものではなく、それらを構成するものでもありません。詳細は利用規約をご覧ください。
招待専用スクリプト
このスクリプトは作者が承認したユーザーのみアクセス可能です。使用するにはアクセス申請をして許可を得る必要があります。通常は支払い後に承認されます。詳細は下記の作者の指示に従うか、CJackiedaBearに直接お問い合わせください。
TradingViewは、作者を完全に信頼し、スクリプトの動作を理解していない限り、有料スクリプトの購入・使用を推奨しません。コミュニティスクリプトには無料のオープンソースの代替が多数あります。
作者の指示
免責事項
この情報および投稿は、TradingViewが提供または推奨する金融、投資、トレード、その他のアドバイスや推奨を意図するものではなく、それらを構成するものでもありません。詳細は利用規約をご覧ください。