OPEN-SOURCE SCRIPT
更新済 Inside Candle Viewer
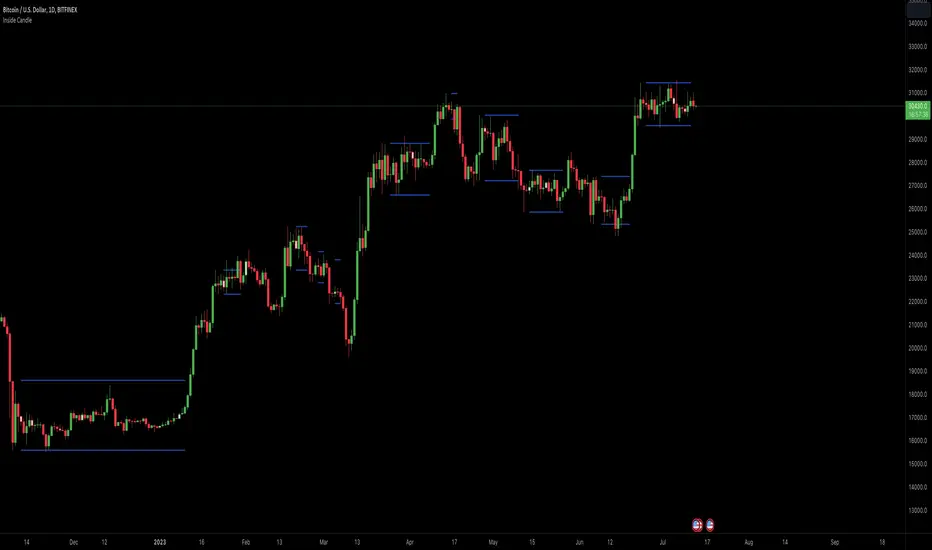
Inside Candle Viewer
What it’s meant for:
- This indicator is used to identify inside candles that might generate an upcoming trading range
- Works best on large timeframe (Suggested from 2 days up to 1 week) and crypto asset (Index don't show much because of daily gaps)
How it works:
- It check for daily close (or the chosen timeframe), highlight inside candles and also plot trading range limits generated by inside pattern
- Trading range limits extend until candle closes are within those limits
- Usually the longer the trading range last, the stronger the following trend is when it break in any direction
Settings:
- Change color of inside bars and enable/disable from chart
- Change color of trading range and enable/disable from chart
Alerts:
- No alerts are defined at the moment
リリースノート
Updated chartリリースノート
- added timeframe selector: as in the shown chart you can be on a daily chart and force a 2 days inside range calculationオープンソーススクリプト
TradingViewの精神に則り、このスクリプトの作者はコードをオープンソースとして公開してくれました。トレーダーが内容を確認・検証できるようにという配慮です。作者に拍手を送りましょう!無料で利用できますが、コードの再公開はハウスルールに従う必要があります。
免責事項
この情報および投稿は、TradingViewが提供または推奨する金融、投資、トレード、その他のアドバイスや推奨を意図するものではなく、それらを構成するものでもありません。詳細は利用規約をご覧ください。
オープンソーススクリプト
TradingViewの精神に則り、このスクリプトの作者はコードをオープンソースとして公開してくれました。トレーダーが内容を確認・検証できるようにという配慮です。作者に拍手を送りましょう!無料で利用できますが、コードの再公開はハウスルールに従う必要があります。
免責事項
この情報および投稿は、TradingViewが提供または推奨する金融、投資、トレード、その他のアドバイスや推奨を意図するものではなく、それらを構成するものでもありません。詳細は利用規約をご覧ください。