OPEN-SOURCE SCRIPT
更新済 ZigZag with Fibonacci Levels
Hello Traders,
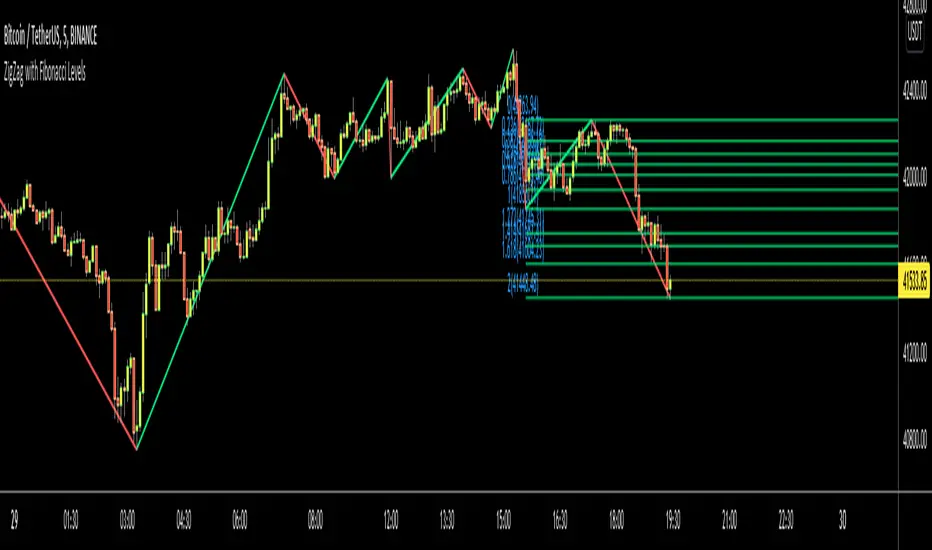
This is "ZigZag with Fibonacci Levels" script. It finds the ZigZag, draw Fibonacci lines and put labels accordingly. I get many requests for this script, so here it is.
You can set ZigZag period as you wish. Bigger numbers (such 20, 30) may give better perspective and result.
It draws Fibonacci levels between 0%-100% and If the price goes higher/lower than 100% level than the script draws Fibonacci Levels accordingly. This means it draws Fibonacci levels until this levels get higher/lower than the price.
As an example:

if you don't want to see ZigZag Lines then you have option to disable it and see only Fibonacci levels:

You have coloring options for Zigzag, Fibonacci lines and texts:

Enjoy!
This is "ZigZag with Fibonacci Levels" script. It finds the ZigZag, draw Fibonacci lines and put labels accordingly. I get many requests for this script, so here it is.
You can set ZigZag period as you wish. Bigger numbers (such 20, 30) may give better perspective and result.
It draws Fibonacci levels between 0%-100% and If the price goes higher/lower than 100% level than the script draws Fibonacci Levels accordingly. This means it draws Fibonacci levels until this levels get higher/lower than the price.
As an example:
if you don't want to see ZigZag Lines then you have option to disable it and see only Fibonacci levels:
You have coloring options for Zigzag, Fibonacci lines and texts:
Enjoy!
リリースノート
Added Price Levels to the labels.リリースノート
- You have now option to enable/disable following Fibonnaci Levels:---> 0.236
---> 0.382
---> 0.500
---> 0.618
---> 0.786
- "Label Location" option added. Fibonacci levels can be shown at Left or Right. when the session is closed then labels at right may not be shown accordingly.
An example: some fibonacci levels disabled, also labeling at right.
リリースノート
Options improvedZigzag part improved
round_to_mintick() function used
bar_index is used for labels (instead of time)
リリースノート
updatedオープンソーススクリプト
TradingViewの精神に則り、このスクリプトの作者はコードをオープンソースとして公開してくれました。トレーダーが内容を確認・検証できるようにという配慮です。作者に拍手を送りましょう!無料で利用できますが、コードの再公開はハウスルールに従う必要があります。
Our official telegram channel is t.me/+nOh3yWZOYINlOWIy
免責事項
この情報および投稿は、TradingViewが提供または推奨する金融、投資、トレード、その他のアドバイスや推奨を意図するものではなく、それらを構成するものでもありません。詳細は利用規約をご覧ください。
オープンソーススクリプト
TradingViewの精神に則り、このスクリプトの作者はコードをオープンソースとして公開してくれました。トレーダーが内容を確認・検証できるようにという配慮です。作者に拍手を送りましょう!無料で利用できますが、コードの再公開はハウスルールに従う必要があります。
Our official telegram channel is t.me/+nOh3yWZOYINlOWIy
免責事項
この情報および投稿は、TradingViewが提供または推奨する金融、投資、トレード、その他のアドバイスや推奨を意図するものではなく、それらを構成するものでもありません。詳細は利用規約をご覧ください。