OPEN-SOURCE SCRIPT
更新済 Hindenburg Omen [QuantNomad]
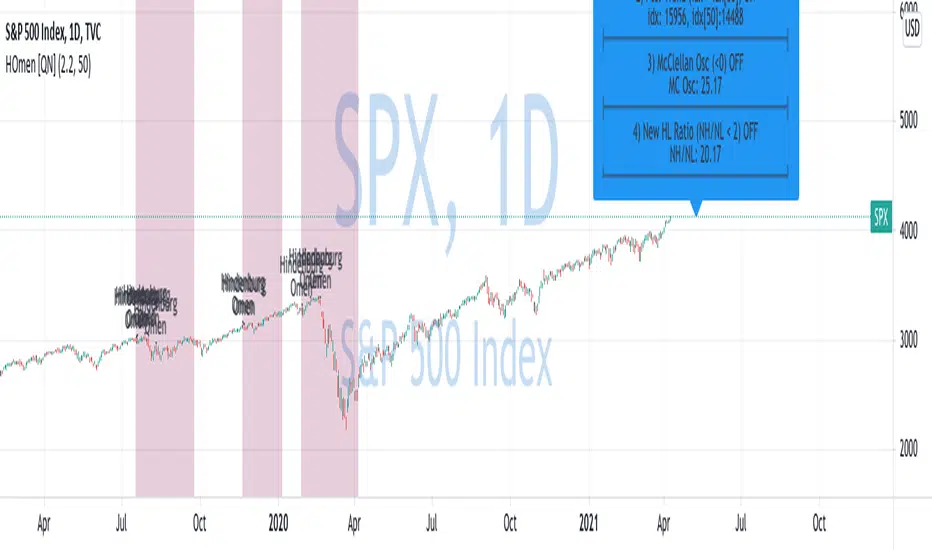
New record highs is good time to look at a market crash indicators )
This is a Hindenburg Omen indicator.
The Hindenburg Omen looks for a statistical deviation from the premise that under normal conditions, securities are either making new 52-week highs or 52-week lows. The abnormality would be if both were occurring at the same time. According to the Hindenburg Omen, an occurrence such as this is considered to be a harbinger of impending danger for a stock market. The signal typically occurs during an uptrend, where new highs are expected and new lows are rare, suggesting that the market is becoming nervous and indecisive, traits that often lead to a bear market.
For it to be on 4 conditions should be satisfied:
1. Number of new 52-week highs and 52-week lows in a stock market are greater than a threshold (2.2% for example).
2. Positive recent trend. Index > index[50]
3. The McClellan Oscillator (MCO) is negative.
4. 52-week highs cannot be more than two times the 52-week lows.
You can read more about the indicator on Investopedia:
investopedia.com/terms/h/hindenburgomen.asp
Based on indicator created by Boombotcom:
リリースノート
I fixed data sources for indicator. Thanks to Marcus for providing me info on new sources. オープンソーススクリプト
TradingViewの精神に則り、このスクリプトの作者はコードをオープンソースとして公開してくれました。トレーダーが内容を確認・検証できるようにという配慮です。作者に拍手を送りましょう!無料で利用できますが、コードの再公開はハウスルールに従う必要があります。
💻 Online Courses and Access to PRO Indicators in the QuanTribe community: qntly.com/qt
💼 Hire Us: qntly.com/pine
📞 Book a call: qntly.com/cons
📰 qntly.com/news
𝕏: qntly.com/x
📩 qntly.com/tel
💼 Hire Us: qntly.com/pine
📞 Book a call: qntly.com/cons
📰 qntly.com/news
𝕏: qntly.com/x
📩 qntly.com/tel
免責事項
この情報および投稿は、TradingViewが提供または推奨する金融、投資、トレード、その他のアドバイスや推奨を意図するものではなく、それらを構成するものでもありません。詳細は利用規約をご覧ください。
オープンソーススクリプト
TradingViewの精神に則り、このスクリプトの作者はコードをオープンソースとして公開してくれました。トレーダーが内容を確認・検証できるようにという配慮です。作者に拍手を送りましょう!無料で利用できますが、コードの再公開はハウスルールに従う必要があります。
💻 Online Courses and Access to PRO Indicators in the QuanTribe community: qntly.com/qt
💼 Hire Us: qntly.com/pine
📞 Book a call: qntly.com/cons
📰 qntly.com/news
𝕏: qntly.com/x
📩 qntly.com/tel
💼 Hire Us: qntly.com/pine
📞 Book a call: qntly.com/cons
📰 qntly.com/news
𝕏: qntly.com/x
📩 qntly.com/tel
免責事項
この情報および投稿は、TradingViewが提供または推奨する金融、投資、トレード、その他のアドバイスや推奨を意図するものではなく、それらを構成するものでもありません。詳細は利用規約をご覧ください。