OPEN-SOURCE SCRIPT
更新済 [RD] Easy dynamic resolution dashboard
=== Easy dynamic resolution dashboard (initial) ===
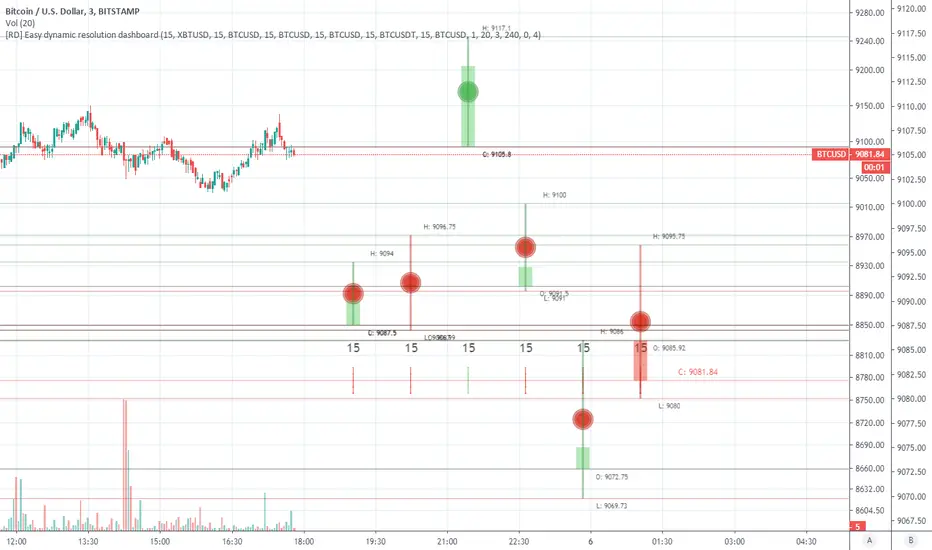
Easy dashboard to show different running reolution bars most of the scale is adjustable.
Current state is initial and could have some bugs, or been in a cleaner way of coding. Let me know if you find something so we could fix it
Best way to start is in a seperate pane to adjust the you like best or most. Afterwards can copied to chart if needed
The round circle in the middle is the avg low|high price of that specifick candle in the resolution
Loading and input adjustments could take a while (reload)
You should get a warning if the current timeframe is higher then the input resolutions choosen. Adjust the reolutions according and you should be fine
Special thanks go to and borrowed some code from
- PineCoders
- RicardoSantos
Notes / Updates
- Let me know where it need (bug) fixes or adjustments
リリースノート
Notes / Updates- Added possibility to different symbols on each resolution and abbility to make use of the current symbol
- Need some work on the alignment of the labels and text looks weird on different symbols and or tf's, needs to be generic
リリースノート
Updated chartUpdate chart screenshot at the scripting section
リリースノート
- quick hack to show each resolution on chartリリースノート
Added another chart layoutオープンソーススクリプト
TradingViewの精神に則り、このスクリプトの作者はコードをオープンソースとして公開してくれました。トレーダーが内容を確認・検証できるようにという配慮です。作者に拍手を送りましょう!無料で利用できますが、コードの再公開はハウスルールに従う必要があります。
免責事項
この情報および投稿は、TradingViewが提供または推奨する金融、投資、トレード、その他のアドバイスや推奨を意図するものではなく、それらを構成するものでもありません。詳細は利用規約をご覧ください。
オープンソーススクリプト
TradingViewの精神に則り、このスクリプトの作者はコードをオープンソースとして公開してくれました。トレーダーが内容を確認・検証できるようにという配慮です。作者に拍手を送りましょう!無料で利用できますが、コードの再公開はハウスルールに従う必要があります。
免責事項
この情報および投稿は、TradingViewが提供または推奨する金融、投資、トレード、その他のアドバイスや推奨を意図するものではなく、それらを構成するものでもありません。詳細は利用規約をご覧ください。