OPEN-SOURCE SCRIPT
Rate of Change w/ Butterworth Filter
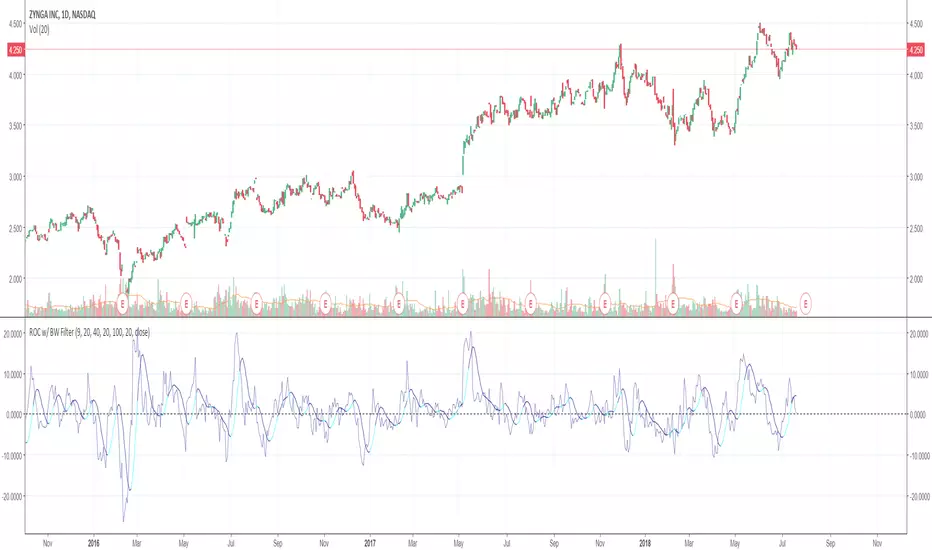
It passes the Rate of Change data through a Butterworth filter which creates a smooth line that can allow for easier detection of slope changes in the data over various periods of times.
The butterworth filter line and the rate of change are plotted together by default. The values for the lengths, for both the butterworth filter and the raw ROC data, can be changed from the format menu (through a toggle).
The shorter the Butterworth length, the closer the line is fitted to the raw ROC data, however you trade of with more frequent slope changes.
The longer the Butterworth length, the smoother the line and less frequent the slope changes, but the Butterworth line is farther of center from the raw ROC data.
オープンソーススクリプト
TradingViewの精神に則り、このスクリプトの作者はコードをオープンソースとして公開してくれました。トレーダーが内容を確認・検証できるようにという配慮です。作者に拍手を送りましょう!無料で利用できますが、コードの再公開はハウスルールに従う必要があります。
免責事項
この情報および投稿は、TradingViewが提供または推奨する金融、投資、トレード、その他のアドバイスや推奨を意図するものではなく、それらを構成するものでもありません。詳細は利用規約をご覧ください。
オープンソーススクリプト
TradingViewの精神に則り、このスクリプトの作者はコードをオープンソースとして公開してくれました。トレーダーが内容を確認・検証できるようにという配慮です。作者に拍手を送りましょう!無料で利用できますが、コードの再公開はハウスルールに従う必要があります。
免責事項
この情報および投稿は、TradingViewが提供または推奨する金融、投資、トレード、その他のアドバイスや推奨を意図するものではなく、それらを構成するものでもありません。詳細は利用規約をご覧ください。