OPEN-SOURCE SCRIPT
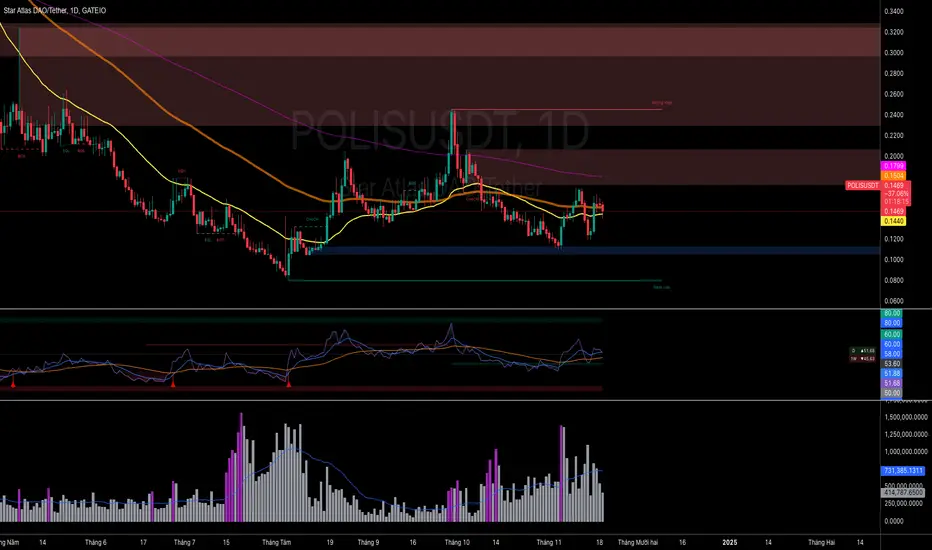
Volume Highlight
Volume Highlight
Description:
This script helps users analyze trading volume by:
1. Highlighting the highest volume bars:
• Trading sessions with volume equal to or exceeding the highest value over the last 20 periods are displayed in purple.
• Other sessions are displayed in light gray.
2. Displaying the 20-period SMA (Simple Moving Average):
• A 20-period SMA line of the volume is included to track the general trend of trading volume.
Key Features:
• Color-coded Highlights:
• Quickly identify trading sessions with significant volume spikes.
• 20-Period SMA Line:
• Observe the overall trend of trading volume.
• Intuitive Volume Bars:
• Volume bars are clearly displayed for easy interpretation.
How to Use:
1. Add the script to your chart on TradingView.
2. Look at the color of the volume bars:
• Purple: Sessions with the highest trading volume in the past 20 periods.
• Light gray: Other sessions.
3. Use the 20-period SMA line to analyze volume trends.
Purpose:
• Analyze market momentum through trading volume.
• Support trading decisions by identifying significant volume spikes.
Illustration:
• A chart showing color-coded volume bars and the 20-period SMA line.
オープンソーススクリプト
TradingViewの精神に則り、このスクリプトの作者はコードをオープンソースとして公開してくれました。トレーダーが内容を確認・検証できるようにという配慮です。作者に拍手を送りましょう!無料で利用できますが、コードの再公開はハウスルールに従う必要があります。
免責事項
この情報および投稿は、TradingViewが提供または推奨する金融、投資、トレード、その他のアドバイスや推奨を意図するものではなく、それらを構成するものでもありません。詳細は利用規約をご覧ください。
オープンソーススクリプト
TradingViewの精神に則り、このスクリプトの作者はコードをオープンソースとして公開してくれました。トレーダーが内容を確認・検証できるようにという配慮です。作者に拍手を送りましょう!無料で利用できますが、コードの再公開はハウスルールに従う必要があります。
免責事項
この情報および投稿は、TradingViewが提供または推奨する金融、投資、トレード、その他のアドバイスや推奨を意図するものではなく、それらを構成するものでもありません。詳細は利用規約をご覧ください。