OPEN-SOURCE SCRIPT
CSI - Calendar Seasonality Index for Bitcoin (BTC) [Logue]
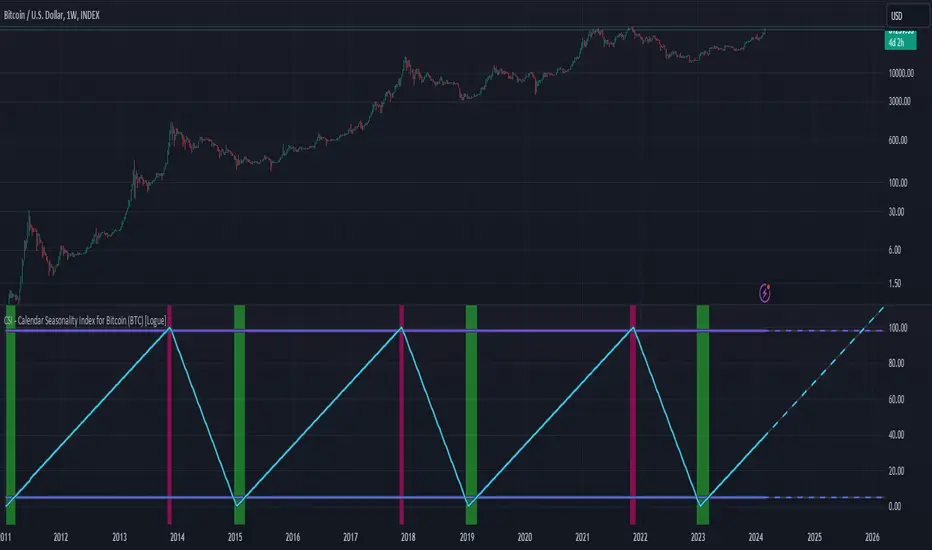
Calendar Seasonality Index (CSI) for Bitcoin (BTC) - The CSI takes advantage of the consistency of BTC cycles. Past cycles have formed macro tops every four years near November 21st, starting from in 2013. Past cycles have formed macro bottoms every four years near January 15th, starting from 2011. Therefore, a linear "risk" curve can be created between the bottom and top dates to measure how close BTC might be to a bottom or a top. The default triggers are at 98% risk for tops and 5% risk for bottoms. Extensions are also added as defaults to allow easy identification of the dates of the next top or bottom according to the CSI.
オープンソーススクリプト
TradingViewの精神に則り、このスクリプトの作者はコードをオープンソースとして公開してくれました。トレーダーが内容を確認・検証できるようにという配慮です。作者に拍手を送りましょう!無料で利用できますが、コードの再公開はハウスルールに従う必要があります。
免責事項
この情報および投稿は、TradingViewが提供または推奨する金融、投資、トレード、その他のアドバイスや推奨を意図するものではなく、それらを構成するものでもありません。詳細は利用規約をご覧ください。
オープンソーススクリプト
TradingViewの精神に則り、このスクリプトの作者はコードをオープンソースとして公開してくれました。トレーダーが内容を確認・検証できるようにという配慮です。作者に拍手を送りましょう!無料で利用できますが、コードの再公開はハウスルールに従う必要があります。
免責事項
この情報および投稿は、TradingViewが提供または推奨する金融、投資、トレード、その他のアドバイスや推奨を意図するものではなく、それらを構成するものでもありません。詳細は利用規約をご覧ください。